Radar Chart
| Difficulty | Intermediate | Time | 60 min+ |
Using statistical data, we will draw a radar chart comparing the per capita food expenditure amounts in Japanese cities (1. Cereals, 2. Seafood, 3. Meat, 4. Dairy products, 5. Vegetables & Seaweed, 6. Fruits). The statistical data used in this course is based on SSDSE (Standard Statistical Dataset for Education) published by the National Statistics Center, converted to a UTF-8 format CSV file.
Please right-click the following URL and select "Save link as" to download. The file name is input1.csv.
Statistical data CSV file download: input1.csv
Place the downloaded CSV file in the App/ folder of your project folder so it can be opened from the program.
1. Set window size and background color

- Create a window large enough for drawing graphs and set the background to a bright color.
Code
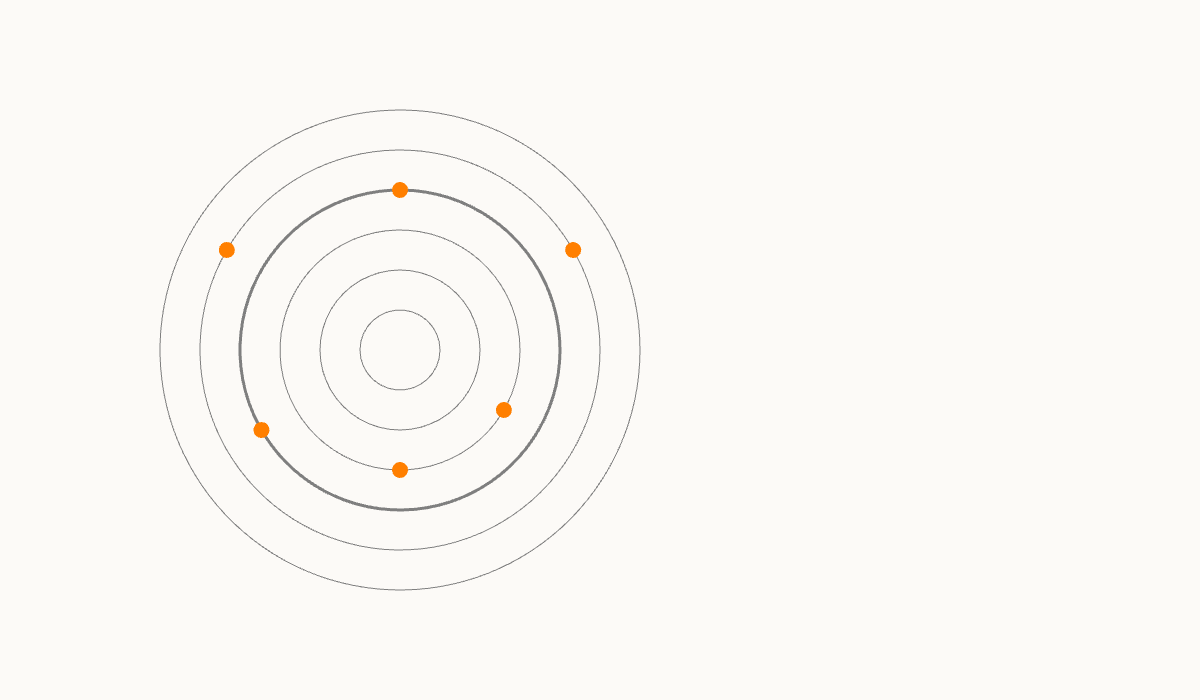
2. Draw radar chart circles

- Draw the radar chart circles. Draw circles every 25%, with the 4th circle at 100% drawn thicker.
Code
# include <Siv3D.hpp>

void Main()
{
	// Resize window to 1200x700
	Window::Resize(1200, 700);

	// Set background color
	Scene::SetBackground(ColorF{ 0.99, 0.98, 0.97 });

	// Radar chart center coordinates
	const Vec2 radarCenter{ 400, 350 };

	while (System::Update())
	{
		// Draw radar chart circles
		for (int32 i = 1; i <= 6; ++i)
		{
			if (i == 4)
			{
				// Draw only the 100% circle thick
				Circle{ radarCenter, (40 * i) }.drawFrame(3, ColorF{ 0.5 });
			}
			else
			{
				Circle{ radarCenter, (40 * i) }.drawFrame(1, ColorF{ 0.5 });
			}
		}
	}
}
3. Prepare a class for data

- Create an
Itemclass to store statistical information. - The member variables of
Itemare as follows:name: City namehousehold: Number of people in householdperHousehold: Array of expenditure amounts per household (0. Cereals, 1. Seafood, 2. Meat, 3. Dairy products, 4. Vegetables & Seaweed, 5. Fruits)perPerson: Array of expenditure amounts per personperPersonRelative: Array of expenditure amounts per person (relative to national average)
- As dummy data, prepare Sapporo city data with arbitrary values.
Code
# include <Siv3D.hpp>

/// @brief Item
struct Item
{
	/// @brief City name
	String city;

	/// @brief Number of people in household
	double household = 0.0;

	/// @brief Expenditure per household
	Array<double> perHousehold;

	/// @brief Expenditure per person
	Array<double> perPerson;

	/// @brief Expenditure per person (relative to national average)
	Array<double> perPersonRelative;
};

void Main()
{
	// Resize window to 1200x700
	Window::Resize(1200, 700);

	// Set background color
	Scene::SetBackground(ColorF{ 0.99, 0.98, 0.97 });

	// Radar chart center coordinates
	const Vec2 radarCenter{ 400, 350 };

	// Dummy item
	const Item item{ U"Sapporo", 1.0, { 100, 200, 300, 400, 500, 600 }, { 100, 200, 300, 400, 500, 600 }, { 1.0, 1.25, 0.75, 0.75, 1.0, 1.25 } };

	while (System::Update())
	{
		// Draw radar chart circles
		for (int32 i = 1; i <= 6; ++i)
		{
			if (i == 4)
			{
				// Draw only the 100% circle thick
				Circle{ radarCenter, (40 * i) }.drawFrame(3, ColorF{ 0.5 });
			}
			else
			{
				Circle{ radarCenter, (40 * i) }.drawFrame(1, ColorF{ 0.5 });
			}
		}

		// Draw radar chart data
		{
			// Sapporo city data
			const auto& values = item.perPersonRelative;

			// ToDo
		}
	}
}
4. Draw points
- Draw each point of the radar chart based on Sapporo's dummy data.
- The
GetPoints()function calculates the coordinates of each point in the radar chart using polar coordinates and returns the result.
Code
# include <Siv3D.hpp>

/// @brief Item
struct Item
{
	/// @brief City name
	String city;

	/// @brief Number of people in household
	double household = 0.0;

	/// @brief Expenditure per household
	Array<double> perHousehold;

	/// @brief Expenditure per person
	Array<double> perPerson;

	/// @brief Expenditure per person (relative to national average)
	Array<double> perPersonRelative;
};

/// @brief Returns an array of point coordinates in the radar chart.
/// @param values Data
/// @param radarCenter Radar chart center coordinates
/// @return Array of point coordinates in the radar chart
Array<Vec2> GetPoints(const Array<double>& values, const Vec2& radarCenter)
{
	// Array of point coordinates
	Array<Vec2> points;

	for (int32 i = 0; i < values.size(); ++i)
	{
		// Angle (0 degrees at 12 o'clock, clockwise)
		const double angle = (i * (360_deg / values.size()));

		// Radius
		const double r = (160 * values[i]);

		// Calculate point coordinates from angle and radius
		const Vec2 pos = OffsetCircular{ radarCenter, r, angle };

		// Add point coordinates to array
		points << pos;
	}

	return points;
}

void Main()
{
	// Resize window to 1200x700
	Window::Resize(1200, 700);

	// Set background color
	Scene::SetBackground(ColorF{ 0.99, 0.98, 0.97 });

	// Radar chart center coordinates
	const Vec2 radarCenter{ 400, 350 };

	// Dummy item
	const Item item{ U"Sapporo", 1.0, { 100, 200, 300, 400, 500, 600 }, { 100, 200, 300, 400, 500, 600 }, { 1.0, 1.25, 0.75, 0.75, 1.0, 1.25 } };

	while (System::Update())
	{
		// Draw radar chart circles
		for (int32 i = 1; i <= 6; ++i)
		{
			if (i == 4)
			{
				// Draw only the 100% circle thick
				Circle{ radarCenter, (40 * i) }.drawFrame(3, ColorF{ 0.5 });
			}
			else
			{
				Circle{ radarCenter, (40 * i) }.drawFrame(1, ColorF{ 0.5 });
			}
		}

		// Draw radar chart data
		{
			// Sapporo city data
			const auto& values = item.perPersonRelative;

			// Array of point coordinates
			const Array<Vec2> points = GetPoints(values, radarCenter);

			// Draw points
			for (const auto& p : points)
			{
				Circle{ p, 8 }.draw(ColorF{ 1.0, 0.5, 0.0 });
			}
		}
	}
}
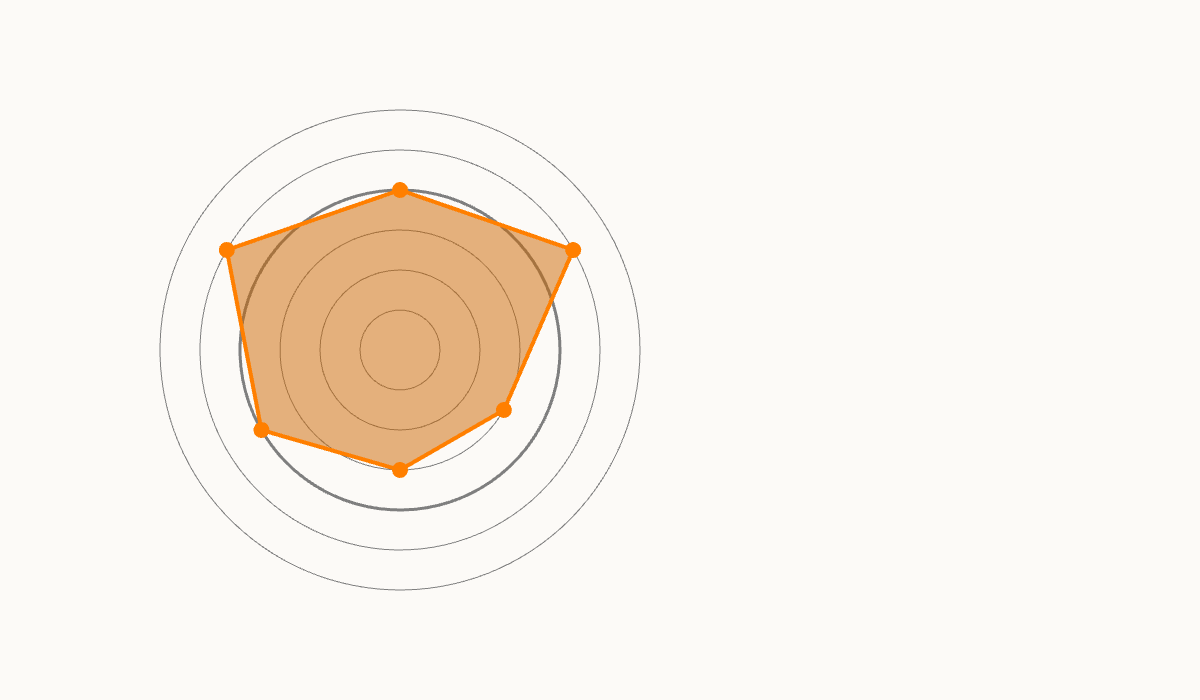
5. Draw polygon

- Draw a polygon connecting each point of the radar chart.
Code
# include <Siv3D.hpp>

/// @brief Item
struct Item
{
	/// @brief City name
	String city;

	/// @brief Number of people in household
	double household = 0.0;

	/// @brief Expenditure per household
	Array<double> perHousehold;

	/// @brief Expenditure per person
	Array<double> perPerson;

	/// @brief Expenditure per person (relative to national average)
	Array<double> perPersonRelative;
};

/// @brief Returns an array of point coordinates in the radar chart.
/// @param values Data
/// @param radarCenter Radar chart center coordinates
/// @return Array of point coordinates in the radar chart
Array<Vec2> GetPoints(const Array<double>& values, const Vec2& radarCenter)
{
	// Array of point coordinates
	Array<Vec2> points;

	for (int32 i = 0; i < values.size(); ++i)
	{
		// Angle (0 degrees at 12 o'clock, clockwise)
		const double angle = (i * (360_deg / values.size()));

		// Radius
		const double r = (160 * values[i]);

		// Calculate point coordinates from angle and radius
		const Vec2 pos = OffsetCircular{ radarCenter, r, angle };

		// Add point coordinates to array
		points << pos;
	}

	return points;
}

void Main()
{
	// Resize window to 1200x700
	Window::Resize(1200, 700);

	// Set background color
	Scene::SetBackground(ColorF{ 0.99, 0.98, 0.97 });

	// Radar chart center coordinates
	const Vec2 radarCenter{ 400, 350 };

	// Dummy item
	const Item item{ U"Sapporo", 1.0, { 100, 200, 300, 400, 500, 600 }, { 100, 200, 300, 400, 500, 600 }, { 1.0, 1.25, 0.75, 0.75, 1.0, 1.25 } };

	while (System::Update())
	{
		// Draw radar chart circles
		for (int32 i = 1; i <= 6; ++i)
		{
			if (i == 4)
			{
				// Draw only the 100% circle thick
				Circle{ radarCenter, (40 * i) }.drawFrame(3, ColorF{ 0.5 });
			}
			else
			{
				Circle{ radarCenter, (40 * i) }.drawFrame(1, ColorF{ 0.5 });
			}
		}

		// Draw radar chart data
		{
			// Sapporo city data
			const auto& values = item.perPersonRelative;

			// Array of point coordinates
			const Array<Vec2> points = GetPoints(values, radarCenter);

			// Radar chart polygon
			const Polygon polygon{ points };

			// Draw polygon
			polygon.draw(ColorF{ 0.8, 0.4, 0.0, 0.5 });

			// Draw polygon frame
			polygon.drawFrame(4, ColorF{ 1.0, 0.5, 0.0 });

			// Draw points
			for (const auto& p : points)
			{
				Circle{ p, 8 }.draw(ColorF{ 1.0, 0.5, 0.0 });
			}
		}
	}
}
6. Load data from CSV file
- Create a function
LoadFromCSV()to load data from a CSV file (partially completed). - Since the CSV file contains irrelevant data, we specify and load cells containing necessary data.
Code
# include <Siv3D.hpp>

/// @brief Item
struct Item
{
	/// @brief City name
	String city;

	/// @brief Number of people in household
	double household = 0.0;

	/// @brief Expenditure per household
	Array<double> perHousehold;

	/// @brief Expenditure per person
	Array<double> perPerson;

	/// @brief Expenditure per person (relative to national average)
	Array<double> perPersonRelative;
};

/// @brief Loads an array of items from a CSV file.
/// @param path CSV file path
/// @return Array of items
Array<Item> LoadFromCSV(const FilePath& path)
{
	// Load CSV file
	const CSV csv{ path };

	if (not csv)
	{
		return{};
	}

	// Array of items
	Array<Item> items;

	// Ignore rows 0 and 1, load data from row 2 to row 50
	for (int32 y = 2; y < 50; ++y)
	{
		// City name
		const String city = csv[y][2];

		// Number of people in household
		const double household = Parse<double>(csv[y][3]);

		// Expenditure per household for each food category
		const double d1 = Parse<double>(csv[y][5]);
		const double d2 = Parse<double>(csv[y][19]);
		const double d3 = Parse<double>(csv[y][55]);
		const double d4 = Parse<double>(csv[y][65]);
		const double d5 = Parse<double>(csv[y][73]);
		const double d6 = Parse<double>(csv[y][121]);

		Item item;
		item.city = city;
		item.household = household;
		item.perHousehold = { d1, d2, d3, d4, d5, d6 };

		// Add item to array
		items << item;
	}

	// ToDo

	return items;
}

/// @brief Returns an array of point coordinates in the radar chart.
/// @param values Data
/// @param radarCenter Radar chart center coordinates
/// @return Array of point coordinates in the radar chart
Array<Vec2> GetPoints(const Array<double>& values, const Vec2& radarCenter)
{
	// Array of point coordinates
	Array<Vec2> points;

	for (int32 i = 0; i < values.size(); ++i)
	{
		// Angle (0 degrees at 12 o'clock, clockwise)
		const double angle = (i * (360_deg / values.size()));

		// Radius
		const double r = (160 * values[i]);

		// Calculate point coordinates from angle and radius
		const Vec2 pos = OffsetCircular{ radarCenter, r, angle };

		// Add point coordinates to array
		points << pos;
	}

	return points;
}

void Main()
{
	// Resize window to 1200x700
	Window::Resize(1200, 700);

	// Set background color
	Scene::SetBackground(ColorF{ 0.99, 0.98, 0.97 });

	// Radar chart center coordinates
	const Vec2 radarCenter{ 400, 350 };

	// Dummy item
	const Item item{ U"Sapporo", 1.0, { 100, 200, 300, 400, 500, 600 }, { 100, 200, 300, 400, 500, 600 }, { 1.0, 1.25, 0.75, 0.75, 1.0, 1.25 } };

	while (System::Update())
	{
		// Draw radar chart circles
		for (int32 i = 1; i <= 6; ++i)
		{
			if (i == 4)
			{
				// Draw only the 100% circle thick
				Circle{ radarCenter, (40 * i) }.drawFrame(3, ColorF{ 0.5 });
			}
			else
			{
				Circle{ radarCenter, (40 * i) }.drawFrame(1, ColorF{ 0.5 });
			}
		}

		// Draw radar chart data
		{
			// Sapporo city data
			const auto& values = item.perPersonRelative;

			// Array of point coordinates
			const Array<Vec2> points = GetPoints(values, radarCenter);

			// Radar chart polygon
			const Polygon polygon{ points };

			// Draw polygon
			polygon.draw(ColorF{ 0.8, 0.4, 0.0, 0.5 });

			// Draw polygon frame
			polygon.drawFrame(4, ColorF{ 1.0, 0.5, 0.0 });

			// Draw points
			for (const auto& p : points)
			{
				Circle{ p, 8 }.draw(ColorF{ 1.0, 0.5, 0.0 });
			}
		}
	}
}
7. Calculate target data
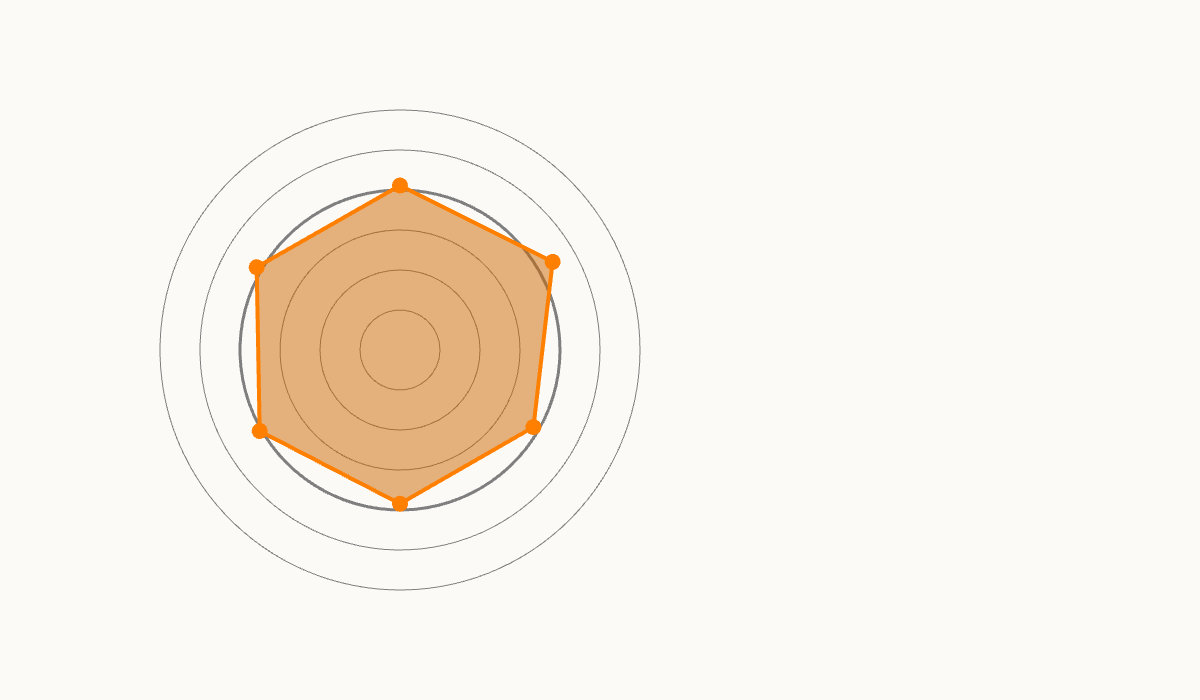
- In
LoadFromCSV(), calculate "expenditure per person" from "expenditure per household", and then calculate "per person expenditure relative to national average". - Draw the radar chart based on Sapporo city (
items[1]) data.
Code
# include <Siv3D.hpp>

/// @brief Item
struct Item
{
	/// @brief City name
	String city;

	/// @brief Number of people in household
	double household = 0.0;

	/// @brief Expenditure per household
	Array<double> perHousehold;

	/// @brief Expenditure per person
	Array<double> perPerson;

	/// @brief Expenditure per person (relative to national average)
	Array<double> perPersonRelative;
};

/// @brief Loads an array of items from a CSV file.
/// @param path CSV file path
/// @return Array of items
Array<Item> LoadFromCSV(const FilePath& path)
{
	// Load CSV file
	const CSV csv{ path };

	if (not csv)
	{
		return{};
	}

	// Array of items
	Array<Item> items;

	// Ignore rows 0 and 1, load data from row 2 to row 50
	for (int32 y = 2; y < 50; ++y)
	{
		// City name
		const String city = csv[y][2];

		// Number of people in household
		const double household = Parse<double>(csv[y][3]);

		// Expenditure per household for each food category
		const double d1 = Parse<double>(csv[y][5]);
		const double d2 = Parse<double>(csv[y][19]);
		const double d3 = Parse<double>(csv[y][55]);
		const double d4 = Parse<double>(csv[y][65]);
		const double d5 = Parse<double>(csv[y][73]);
		const double d6 = Parse<double>(csv[y][121]);

		Item item;
		item.city = city;
		item.household = household;
		item.perHousehold = { d1, d2, d3, d4, d5, d6 };

		// Add item to array
		items << item;
	}

	// For each city
	for (auto& item : items)
	{
		item.perPerson = item.perHousehold;

		for (auto& perPerson : item.perPerson)
		{
			// Calculate expenditure per person
			perPerson /= item.household;
		}

		item.perPersonRelative = item.perPerson;

		for (size_t i = 0; auto& perPersonRelative : item.perPersonRelative)
		{
			// Calculate ratio to national average items[0]
			perPersonRelative /= items[0].perPerson[i];
			++i;
		}
	}

	return items;
}

/// @brief Returns an array of point coordinates in the radar chart.
/// @param values Data
/// @param radarCenter Radar chart center coordinates
/// @return Array of point coordinates in the radar chart
Array<Vec2> GetPoints(const Array<double>& values, const Vec2& radarCenter)
{
	// Array of point coordinates
	Array<Vec2> points;

	for (int32 i = 0; i < values.size(); ++i)
	{
		// Angle (0 degrees at 12 o'clock, clockwise)
		const double angle = (i * (360_deg / values.size()));

		// Radius
		const double r = (160 * values[i]);

		// Calculate point coordinates from angle and radius
		const Vec2 pos = OffsetCircular{ radarCenter, r, angle };

		// Add point coordinates to array
		points << pos;
	}

	return points;
}

void Main()
{
	// Resize window to 1200x700
	Window::Resize(1200, 700);

	// Set background color
	Scene::SetBackground(ColorF{ 0.99, 0.98, 0.97 });

	// Radar chart center coordinates
	const Vec2 radarCenter{ 400, 350 };

	// Load array of items from CSV file
	const Array<Item> items = LoadFromCSV(U"input1.csv");

	if (not items)
	{
		throw Error{ U"Failed to load CSV file" };
	}

	while (System::Update())
	{
		// Draw radar chart circles
		for (int32 i = 1; i <= 6; ++i)
		{
			if (i == 4)
			{
				// Draw only the 100% circle thick
				Circle{ radarCenter, (40 * i) }.drawFrame(3, ColorF{ 0.5 });
			}
			else
			{
				Circle{ radarCenter, (40 * i) }.drawFrame(1, ColorF{ 0.5 });
			}
		}

		// Draw radar chart data
		{
			// Sapporo city data
			const auto& values = items[1].perPersonRelative;

			// Array of point coordinates
			const Array<Vec2> points = GetPoints(values, radarCenter);

			// Radar chart polygon
			const Polygon polygon{ points };

			// Draw polygon
			polygon.draw(ColorF{ 0.8, 0.4, 0.0, 0.5 });

			// Draw polygon frame
			polygon.drawFrame(4, ColorF{ 1.0, 0.5, 0.0 });

			// Draw points
			for (const auto& p : points)
			{
				Circle{ p, 8 }.draw(ColorF{ 1.0, 0.5, 0.0 });
			}
		}
	}
}
8. Using list box
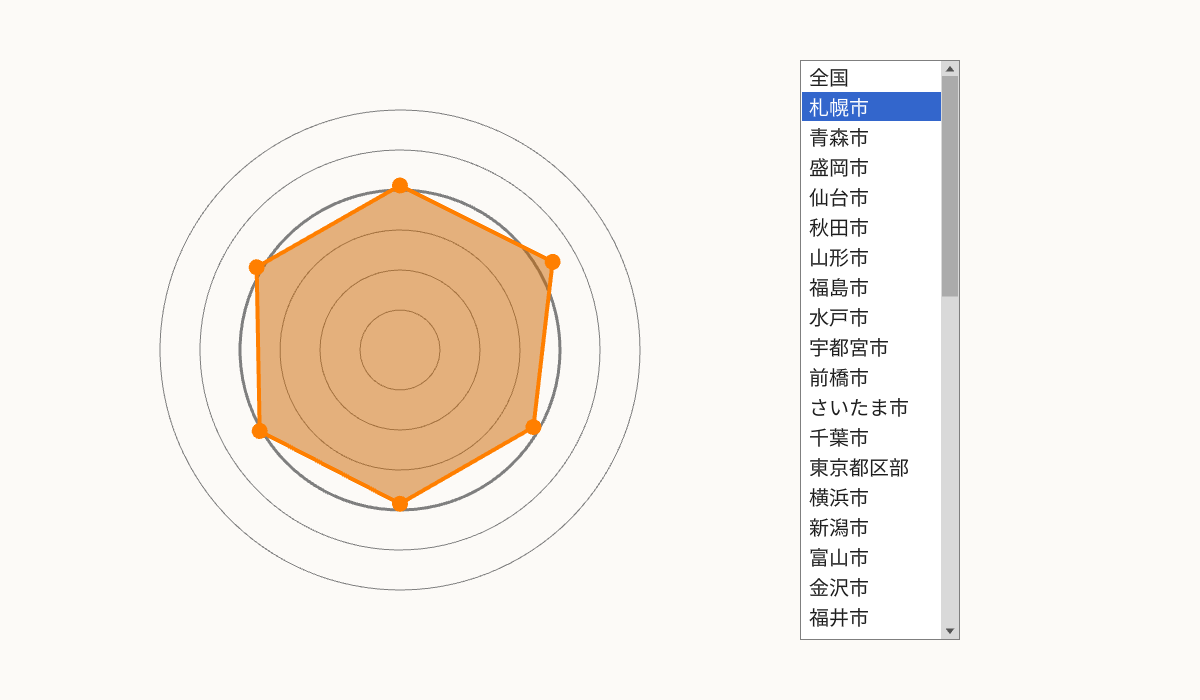
- Use Siv3D's GUI feature "list box" to display city names.
- Use the
.map()member function ofArrayto create an array of city namesArray<String>and set it as the list of items for the list box. - At this point, selecting a city in the list box doesn't do anything, but in the next step we'll display the data for the selected city.
Code
# include <Siv3D.hpp>

/// @brief Item
struct Item
{
	/// @brief City name
	String city;

	/// @brief Number of people in household
	double household = 0.0;

	/// @brief Expenditure per household
	Array<double> perHousehold;

	/// @brief Expenditure per person
	Array<double> perPerson;

	/// @brief Expenditure per person (relative to national average)
	Array<double> perPersonRelative;
};

/// @brief Loads an array of items from a CSV file.
/// @param path CSV file path
/// @return Array of items
Array<Item> LoadFromCSV(const FilePath& path)
{
	// Load CSV file
	const CSV csv{ path };

	if (not csv)
	{
		return{};
	}

	// Array of items
	Array<Item> items;

	// Ignore rows 0 and 1, load data from row 2 to row 50
	for (int32 y = 2; y < 50; ++y)
	{
		// City name
		const String city = csv[y][2];

		// Number of people in household
		const double household = Parse<double>(csv[y][3]);

		// Expenditure per household for each food category
		const double d1 = Parse<double>(csv[y][5]);
		const double d2 = Parse<double>(csv[y][19]);
		const double d3 = Parse<double>(csv[y][55]);
		const double d4 = Parse<double>(csv[y][65]);
		const double d5 = Parse<double>(csv[y][73]);
		const double d6 = Parse<double>(csv[y][121]);

		Item item;
		item.city = city;
		item.household = household;
		item.perHousehold = { d1, d2, d3, d4, d5, d6 };

		// Add item to array
		items << item;
	}

	// For each city
	for (auto& item : items)
	{
		item.perPerson = item.perHousehold;

		for (auto& perPerson : item.perPerson)
		{
			// Calculate expenditure per person
			perPerson /= item.household;
		}

		item.perPersonRelative = item.perPerson;

		for (size_t i = 0; auto& perPersonRelative : item.perPersonRelative)
		{
			// Calculate ratio to national average items[0]
			perPersonRelative /= items[0].perPerson[i];
			++i;
		}
	}

	return items;
}

/// @brief Returns an array of point coordinates in the radar chart.
/// @param values Data
/// @param radarCenter Radar chart center coordinates
/// @return Array of point coordinates in the radar chart
Array<Vec2> GetPoints(const Array<double>& values, const Vec2& radarCenter)
{
	// Array of point coordinates
	Array<Vec2> points;

	for (int32 i = 0; i < values.size(); ++i)
	{
		// Angle (0 degrees at 12 o'clock, clockwise)
		const double angle = (i * (360_deg / values.size()));

		// Radius
		const double r = (160 * values[i]);

		// Calculate point coordinates from angle and radius
		const Vec2 pos = OffsetCircular{ radarCenter, r, angle };

		// Add point coordinates to array
		points << pos;
	}

	return points;
}

void Main()
{
	// Resize window to 1200x700
	Window::Resize(1200, 700);

	// Set background color
	Scene::SetBackground(ColorF{ 0.99, 0.98, 0.97 });

	// Radar chart center coordinates
	const Vec2 radarCenter{ 400, 350 };

	// Load array of items from CSV file
	const Array<Item> items = LoadFromCSV(U"input1.csv");

	if (not items)
	{
		throw Error{ U"Failed to load CSV file" };
	}

	// Prepare list box consisting of city names
	ListBoxState listbox{ items.map([](const Item& item) { return item.city; }) };

	while (System::Update())
	{
		// Draw list box
		SimpleGUI::ListBox(listbox, Vec2{ 800, 60 }, 160, 580);

		// Draw radar chart circles
		for (int32 i = 1; i <= 6; ++i)
		{
			if (i == 4)
			{
				// Draw only the 100% circle thick
				Circle{ radarCenter, (40 * i) }.drawFrame(3, ColorF{ 0.5 });
			}
			else
			{
				Circle{ radarCenter, (40 * i) }.drawFrame(1, ColorF{ 0.5 });
			}
		}

		// Draw radar chart data
		{
			// Sapporo city data
			const auto& values = items[1].perPersonRelative;

			// Array of point coordinates
			const Array<Vec2> points = GetPoints(values, radarCenter);

			// Radar chart polygon
			const Polygon polygon{ points };

			// Draw polygon
			polygon.draw(ColorF{ 0.8, 0.4, 0.0, 0.5 });

			// Draw polygon frame
			polygon.drawFrame(4, ColorF{ 1.0, 0.5, 0.0 });

			// Draw points
			for (const auto& p : points)
			{
				Circle{ p, 8 }.draw(ColorF{ 1.0, 0.5, 0.0 });
			}
		}
	}
}
9. Use data of the item selected in the list box
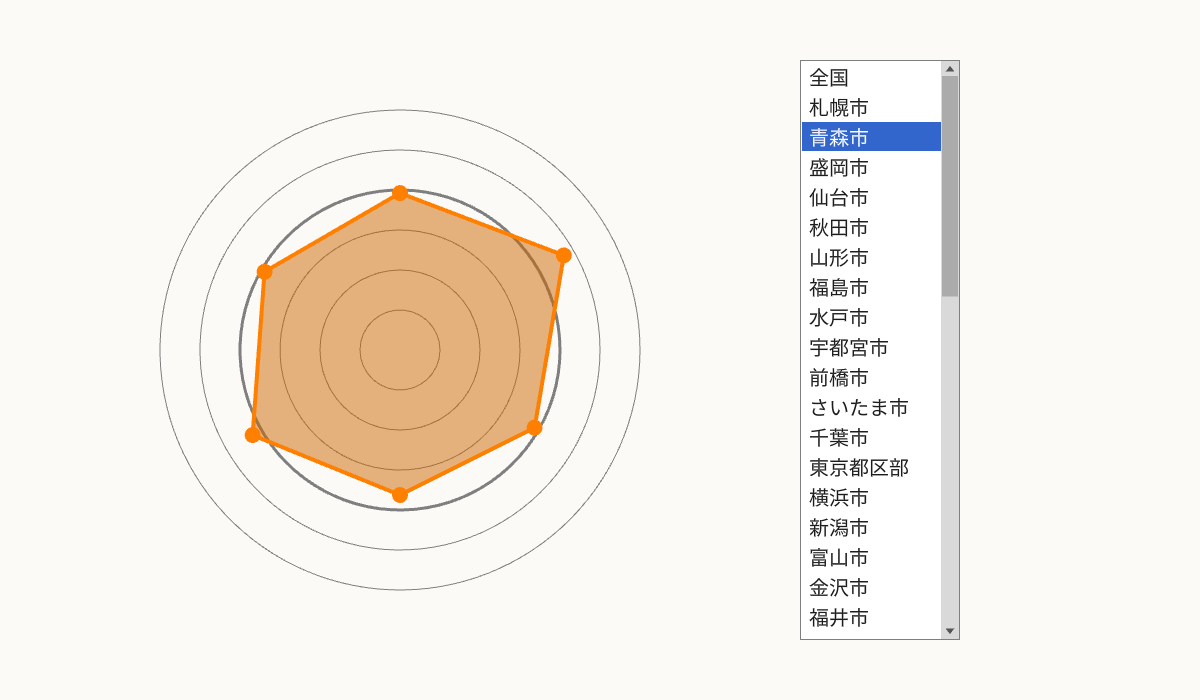
- Draw the radar chart using the data of the city selected in the list box.
listbox.selectedItemIndex.value_or(0)returns the index of the item selected in the list boxlistbox. Returns 0 if nothing is selected.
Code
# include <Siv3D.hpp>

/// @brief Item
struct Item
{
	/// @brief City name
	String city;

	/// @brief Number of people in household
	double household = 0.0;

	/// @brief Expenditure per household
	Array<double> perHousehold;

	/// @brief Expenditure per person
	Array<double> perPerson;

	/// @brief Expenditure per person (relative to national average)
	Array<double> perPersonRelative;
};

/// @brief Loads an array of items from a CSV file.
/// @param path CSV file path
/// @return Array of items
Array<Item> LoadFromCSV(const FilePath& path)
{
	// Load CSV file
	const CSV csv{ path };

	if (not csv)
	{
		return{};
	}

	// Array of items
	Array<Item> items;

	// Ignore rows 0 and 1, load data from row 2 to row 50
	for (int32 y = 2; y < 50; ++y)
	{
		// City name
		const String city = csv[y][2];

		// Number of people in household
		const double household = Parse<double>(csv[y][3]);

		// Expenditure per household for each food category
		const double d1 = Parse<double>(csv[y][5]);
		const double d2 = Parse<double>(csv[y][19]);
		const double d3 = Parse<double>(csv[y][55]);
		const double d4 = Parse<double>(csv[y][65]);
		const double d5 = Parse<double>(csv[y][73]);
		const double d6 = Parse<double>(csv[y][121]);

		Item item;
		item.city = city;
		item.household = household;
		item.perHousehold = { d1, d2, d3, d4, d5, d6 };

		// Add item to array
		items << item;
	}

	// For each city
	for (auto& item : items)
	{
		item.perPerson = item.perHousehold;

		for (auto& perPerson : item.perPerson)
		{
			// Calculate expenditure per person
			perPerson /= item.household;
		}

		item.perPersonRelative = item.perPerson;

		for (size_t i = 0; auto& perPersonRelative : item.perPersonRelative)
		{
			// Calculate ratio to national average items[0]
			perPersonRelative /= items[0].perPerson[i];
			++i;
		}
	}

	return items;
}

/// @brief Returns an array of point coordinates in the radar chart.
/// @param values Data
/// @param radarCenter Radar chart center coordinates
/// @return Array of point coordinates in the radar chart
Array<Vec2> GetPoints(const Array<double>& values, const Vec2& radarCenter)
{
	// Array of point coordinates
	Array<Vec2> points;

	for (int32 i = 0; i < values.size(); ++i)
	{
		// Angle (0 degrees at 12 o'clock, clockwise)
		const double angle = (i * (360_deg / values.size()));

		// Radius
		const double r = (160 * values[i]);

		// Calculate point coordinates from angle and radius
		const Vec2 pos = OffsetCircular{ radarCenter, r, angle };

		// Add point coordinates to array
		points << pos;
	}

	return points;
}

void Main()
{
	// Resize window to 1200x700
	Window::Resize(1200, 700);

	// Set background color
	Scene::SetBackground(ColorF{ 0.99, 0.98, 0.97 });

	// Radar chart center coordinates
	const Vec2 radarCenter{ 400, 350 };

	// Load array of items from CSV file
	const Array<Item> items = LoadFromCSV(U"input1.csv");

	if (not items)
	{
		throw Error{ U"Failed to load CSV file" };
	}

	// Prepare list box consisting of city names
	ListBoxState listbox{ items.map([](const Item& item) { return item.city; }) };

	while (System::Update())
	{
		// Draw list box
		SimpleGUI::ListBox(listbox, Vec2{ 800, 60 }, 160, 580);

		// Draw radar chart circles
		for (int32 i = 1; i <= 6; ++i)
		{
			if (i == 4)
			{
				// Draw only the 100% circle thick
				Circle{ radarCenter, (40 * i) }.drawFrame(3, ColorF{ 0.5 });
			}
			else
			{
				Circle{ radarCenter, (40 * i) }.drawFrame(1, ColorF{ 0.5 });
			}
		}

		// Draw radar chart data
		{
			// Data of the city selected in the list box
			const auto& values = items[listbox.selectedItemIndex.value_or(0)].perPersonRelative;

			// Array of point coordinates
			const Array<Vec2> points = GetPoints(values, radarCenter);

			// Radar chart polygon
			const Polygon polygon{ points };

			// Draw polygon
			polygon.draw(ColorF{ 0.8, 0.4, 0.0, 0.5 });

			// Draw polygon frame
			polygon.drawFrame(4, ColorF{ 1.0, 0.5, 0.0 });

			// Draw points
			for (const auto& p : points)
			{
				Circle{ p, 8 }.draw(ColorF{ 1.0, 0.5, 0.0 });
			}
		}
	}
}
10. Draw labels
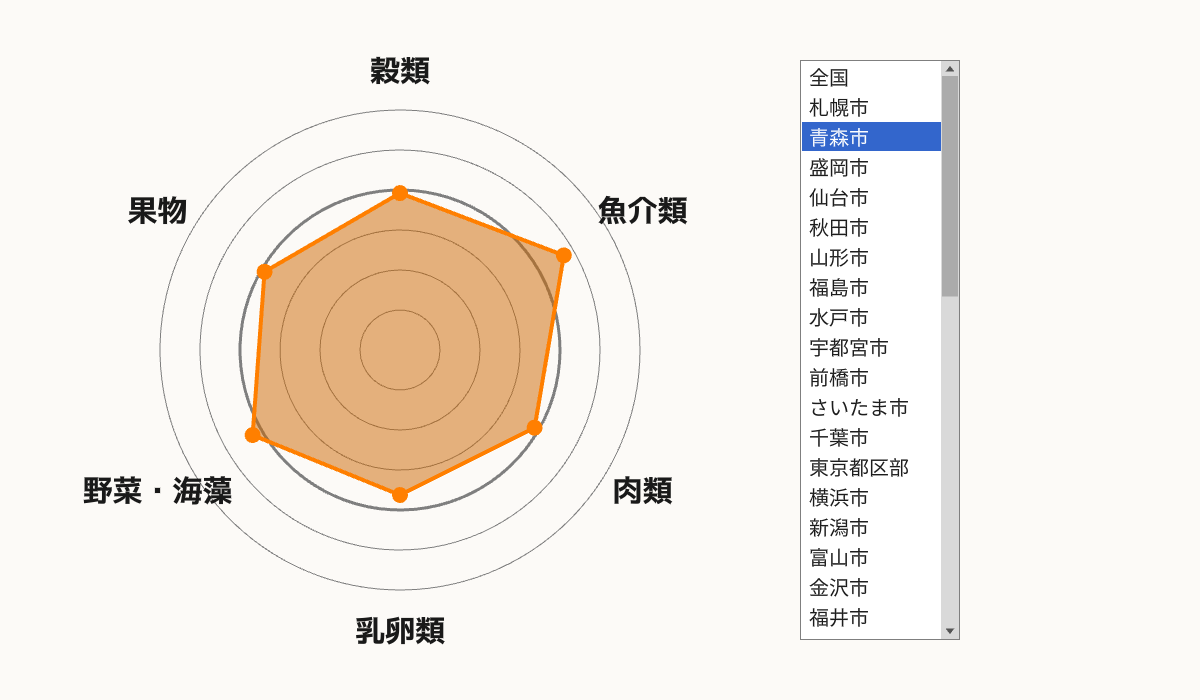
- Draw labels at each vertex of the radar chart.
Code
# include <Siv3D.hpp>

/// @brief Item
struct Item
{
	/// @brief City name
	String city;

	/// @brief Number of people in household
	double household = 0.0;

	/// @brief Expenditure per household
	Array<double> perHousehold;

	/// @brief Expenditure per person
	Array<double> perPerson;

	/// @brief Expenditure per person (relative to national average)
	Array<double> perPersonRelative;
};

/// @brief Loads an array of items from a CSV file.
/// @param path CSV file path
/// @return Array of items
Array<Item> LoadFromCSV(const FilePath& path)
{
	// Load CSV file
	const CSV csv{ path };

	if (not csv)
	{
		return{};
	}

	// Array of items
	Array<Item> items;

	// Ignore rows 0 and 1, load data from row 2 to row 50
	for (int32 y = 2; y < 50; ++y)
	{
		// City name
		const String city = csv[y][2];

		// Number of people in household
		const double household = Parse<double>(csv[y][3]);

		// Expenditure per household for each food category
		const double d1 = Parse<double>(csv[y][5]);
		const double d2 = Parse<double>(csv[y][19]);
		const double d3 = Parse<double>(csv[y][55]);
		const double d4 = Parse<double>(csv[y][65]);
		const double d5 = Parse<double>(csv[y][73]);
		const double d6 = Parse<double>(csv[y][121]);

		Item item;
		item.city = city;
		item.household = household;
		item.perHousehold = { d1, d2, d3, d4, d5, d6 };

		// Add item to array
		items << item;
	}

	// For each city
	for (auto& item : items)
	{
		item.perPerson = item.perHousehold;

		for (auto& perPerson : item.perPerson)
		{
			// Calculate expenditure per person
			perPerson /= item.household;
		}

		item.perPersonRelative = item.perPerson;

		for (size_t i = 0; auto& perPersonRelative : item.perPersonRelative)
		{
			// Calculate ratio to national average items[0]
			perPersonRelative /= items[0].perPerson[i];
			++i;
		}
	}

	return items;
}

/// @brief Returns an array of point coordinates in the radar chart.
/// @param values Data
/// @param radarCenter Radar chart center coordinates
/// @return Array of point coordinates in the radar chart
Array<Vec2> GetPoints(const Array<double>& values, const Vec2& radarCenter)
{
	// Array of point coordinates
	Array<Vec2> points;

	for (int32 i = 0; i < values.size(); ++i)
	{
		// Angle (0 degrees at 12 o'clock, clockwise)
		const double angle = (i * (360_deg / values.size()));

		// Radius
		const double r = (160 * values[i]);

		// Calculate point coordinates from angle and radius
		const Vec2 pos = OffsetCircular{ radarCenter, r, angle };

		// Add point coordinates to array
		points << pos;
	}

	return points;
}

void Main()
{
	// Resize window to 1200x700
	Window::Resize(1200, 700);

	// Set background color
	Scene::SetBackground(ColorF{ 0.99, 0.98, 0.97 });

	// Prepare font
	const Font font{ FontMethod::MSDF, 40, Typeface::Bold };

	// Radar chart labels
	const Array<String> labels = { U"Cereals", U"Seafood", U"Meat", U"Dairy & Eggs", U"Vegetables & Seaweed", U"Fruits" };

	// Radar chart center coordinates
	const Vec2 radarCenter{ 400, 350 };

	// Load array of items from CSV file
	const Array<Item> items = LoadFromCSV(U"input1.csv");

	if (not items)
	{
		throw Error{ U"Failed to load CSV file" };
	}

	// Prepare list box consisting of city names
	ListBoxState listbox{ items.map([](const Item& item) { return item.city; }) };

	while (System::Update())
	{
		// Draw list box
		SimpleGUI::ListBox(listbox, Vec2{ 800, 60 }, 160, 580);

		// Draw radar chart circles
		for (int32 i = 1; i <= 6; ++i)
		{
			if (i == 4)
			{
				// Draw only the 100% circle thick
				Circle{ radarCenter, (40 * i) }.drawFrame(3, ColorF{ 0.5 });
			}
			else
			{
				Circle{ radarCenter, (40 * i) }.drawFrame(1, ColorF{ 0.5 });
			}
		}

		// Draw radar chart data
		{
			// Data of the city selected in the list box
			const auto& values = items[listbox.selectedItemIndex.value_or(0)].perPersonRelative;

			// Array of point coordinates
			const Array<Vec2> points = GetPoints(values, radarCenter);

			// Radar chart polygon
			const Polygon polygon{ points };

			// Draw polygon
			polygon.draw(ColorF{ 0.8, 0.4, 0.0, 0.5 });

			// Draw polygon frame
			polygon.drawFrame(4, ColorF{ 1.0, 0.5, 0.0 });

			// Draw points
			for (const auto& p : points)
			{
				Circle{ p, 8 }.draw(ColorF{ 1.0, 0.5, 0.0 });
			}
		}

		// Draw radar chart labels
		for (int32 i = 0; i < labels.size(); ++i)
		{
			// Angle
			const double angle = (i * (360_deg / labels.size()));

			// Label coordinates
			const Vec2 pos = OffsetCircular{ radarCenter, 280, angle };

			// Draw label
			font(labels[i]).drawAt(30, pos, ColorF{ 0.1 });
		}
	}
}
Advanced Features
From here on, try improving the radar chart program by thinking for yourself.
Feature Ideas
- Display data numbers
- Compare two items
- Draw radar charts using more data
- Make more use of data included in CSV
Design Ideas
- Arrange UI size and layout
- Display scales like 50%, 75%, 100%
- Display graph title and description
- Emphasize when values are significantly different from average
Challenge
- Try creating a program that draws new graphs using the same data as this time or different data obtained from the internet.
- When using CSV files, save them as UTF-8 format CSV files using spreadsheet software like Excel in advance.