レーダーチャート
| 難易度 | 中級 | 時間 | 60 分~ |
統計データを用いて、日本の各都市における 1 人あたりの食料支出金額(1. 穀類、2. 魚介類、3. 肉類、4. 乳製品、5. 野菜・海藻、6. 果物)を比較するレーダーチャートを描画します。本コースで使用する統計データは、独立行政法人統計センターが公開している SSDSE(教育用標準データセット) を UTF-8 形式の CSV ファイルに改変したものです。
次の URL を右クリックして「名前を付けてリンク先を保存」でダウンロードしてください。ファイル名は input1.csv です。
統計データ CSV ファイルダウンロード: input1.csv
ダウンロードした CSV ファイルは、プログラムから開けるよう、プロジェクトフォルダの App/ フォルダ内に配置します。
1. ウィンドウサイズと背景色を設定する

- グラフの描画に十分な大きさのウィンドウを作成し、背景を明るい色に設定します。
コード
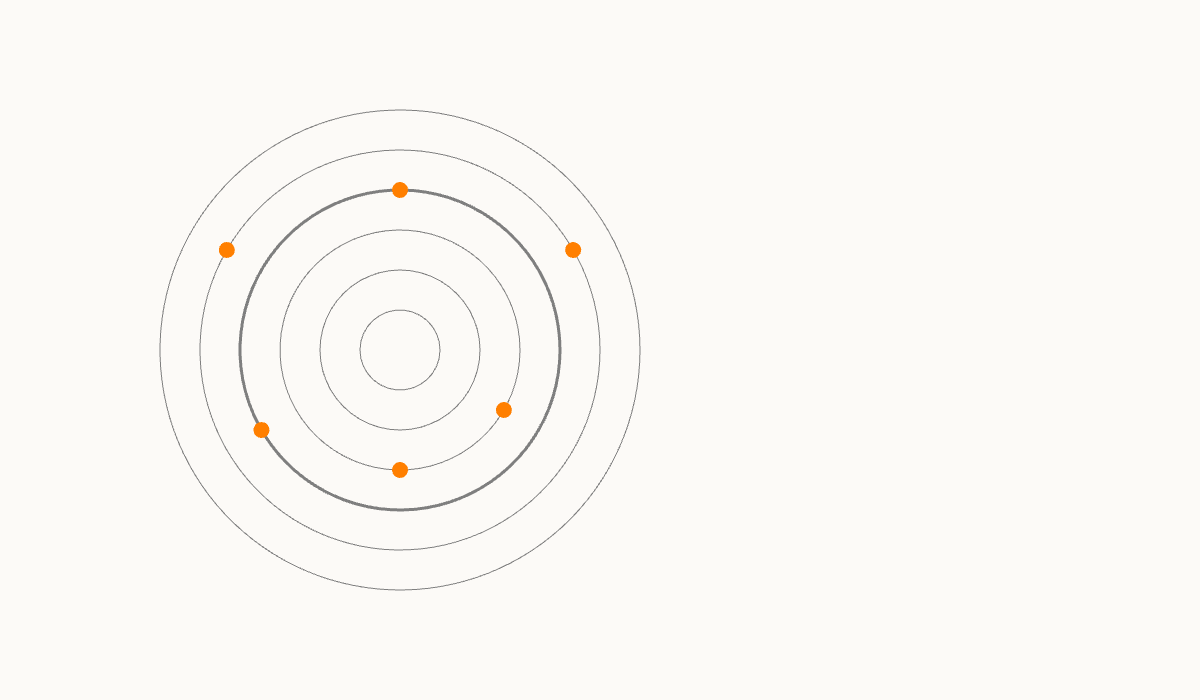
2. レーダーチャートの円を描画する

- レーダーチャートの円を描画します。25 % ごとに円を描画し、4 番目の 100 % の円は太く描画します。
コード
# include <Siv3D.hpp>

void Main()
{
	// ウィンドウを 1200x700 にリサイズする
	Window::Resize(1200, 700);

	// 背景色を設定する
	Scene::SetBackground(ColorF{ 0.99, 0.98, 0.97 });

	// レーダーチャートの中心座標
	const Vec2 radarCenter{ 400, 350 };

	while (System::Update())
	{
		// レーダーチャートの円を描画する
		for (int32 i = 1; i <= 6; ++i)
		{
			if (i == 4)
			{
				// 100 % の円だけ太く描画する
				Circle{ radarCenter, (40 * i) }.drawFrame(3, ColorF{ 0.5 });
			}
			else
			{
				Circle{ radarCenter, (40 * i) }.drawFrame(1, ColorF{ 0.5 });
			}
		}
	}
}
3. データ用のクラスを用意する

- 統計情報を格納するクラス
Itemを作成します。 Itemのメンバ変数は次のとおりです。name: 都市名household: 世帯の人数perHousehold: 1 世帯あたりの支出金額(0. 穀類、1. 魚介類、2. 肉類、3. 乳製品、4. 野菜・海藻、5. 果物)の配列perPerson: 1 人あたりの支出金額の配列perPersonRelative: 1 人あたりの支出金額(全国平均比)の配列
- 仮のデータとして、札幌市のデータを適当な値で用意します。
コード
# include <Siv3D.hpp>

/// @brief アイテム
struct Item
{
	/// @brief 都市の名前
	String city;

	/// @brief 世帯の人数
	double household = 0.0;

	/// @brief 1 世帯あたりの支出
	Array<double> perHousehold;

	/// @brief 1 人あたりの支出
	Array<double> perPerson;

	/// @brief 1 人あたりの支出(全国平均比)
	Array<double> perPersonRelative;
};

void Main()
{
	// ウィンドウを 1200x700 にリサイズする
	Window::Resize(1200, 700);

	// 背景色を設定する
	Scene::SetBackground(ColorF{ 0.99, 0.98, 0.97 });

	// レーダーチャートの中心座標
	const Vec2 radarCenter{ 400, 350 };

	// 仮のアイテム
	const Item item{ U"札幌市", 1.0, { 100, 200, 300, 400, 500, 600 }, { 100, 200, 300, 400, 500, 600 }, { 1.0, 1.25, 0.75, 0.75, 1.0, 1.25 } };

	while (System::Update())
	{
		// レーダーチャートの円を描画する
		for (int32 i = 1; i <= 6; ++i)
		{
			if (i == 4)
			{
				// 100 % の円だけ太く描画する
				Circle{ radarCenter, (40 * i) }.drawFrame(3, ColorF{ 0.5 });
			}
			else
			{
				Circle{ radarCenter, (40 * i) }.drawFrame(1, ColorF{ 0.5 });
			}
		}

		// レーダーチャートのデータを描画する
		{
			// 札幌市のデータ
			const auto& values = item.perPersonRelative;

			// ToDo
		}
	}
}
4. 点を描画する
- 札幌市の仮のデータをもとに、レーダーチャートの各点を描画します。
GetPoints()関数は、レーダーチャートにおける各点の座標を円座標を使って計算し、その結果を返します。
コード
# include <Siv3D.hpp>

/// @brief アイテム
struct Item
{
	/// @brief 都市の名前
	String city;

	/// @brief 世帯の人数
	double household = 0.0;

	/// @brief 1 世帯あたりの支出
	Array<double> perHousehold;

	/// @brief 1 人あたりの支出
	Array<double> perPerson;

	/// @brief 1 人あたりの支出(全国平均比)
	Array<double> perPersonRelative;
};

/// @brief レーダーチャートにおける点の座標の配列を返します。
/// @param values データ
/// @param radarCenter レーダーチャートの中心座標
/// @return レーダーチャートにおける点の座標の配列
Array<Vec2> GetPoints(const Array<double>& values, const Vec2& radarCenter)
{
	// 点の座標の配列
	Array<Vec2> points;

	for (int32 i = 0; i < values.size(); ++i)
	{
		// 角度(0 時の方向が 0 度、時計回り)
		const double angle = (i * (360_deg / values.size()));

		// 半径
		const double r = (160 * values[i]);

		// 角度と半径から点の座標を計算する
		const Vec2 pos = OffsetCircular{ radarCenter, r, angle };

		// 点の座標を配列に追加する
		points << pos;
	}

	return points;
}

void Main()
{
	// ウィンドウを 1200x700 にリサイズする
	Window::Resize(1200, 700);

	// 背景色を設定する
	Scene::SetBackground(ColorF{ 0.99, 0.98, 0.97 });

	// レーダーチャートの中心座標
	const Vec2 radarCenter{ 400, 350 };

	// 仮のアイテム
	const Item item{ U"札幌市", 1.0, { 100, 200, 300, 400, 500, 600 }, { 100, 200, 300, 400, 500, 600 }, { 1.0, 1.25, 0.75, 0.75, 1.0, 1.25 } };

	while (System::Update())
	{
		// レーダーチャートの円を描画する
		for (int32 i = 1; i <= 6; ++i)
		{
			if (i == 4)
			{
				// 100 % の円だけ太く描画する
				Circle{ radarCenter, (40 * i) }.drawFrame(3, ColorF{ 0.5 });
			}
			else
			{
				Circle{ radarCenter, (40 * i) }.drawFrame(1, ColorF{ 0.5 });
			}
		}

		// レーダーチャートのデータを描画する
		{
			// 札幌市のデータ
			const auto& values = item.perPersonRelative;

			// 点の座標の配列
			const Array<Vec2> points = GetPoints(values, radarCenter);

			// 点を描画する
			for (const auto& p : points)
			{
				Circle{ p, 8 }.draw(ColorF{ 1.0, 0.5, 0.0 });
			}
		}
	}
}
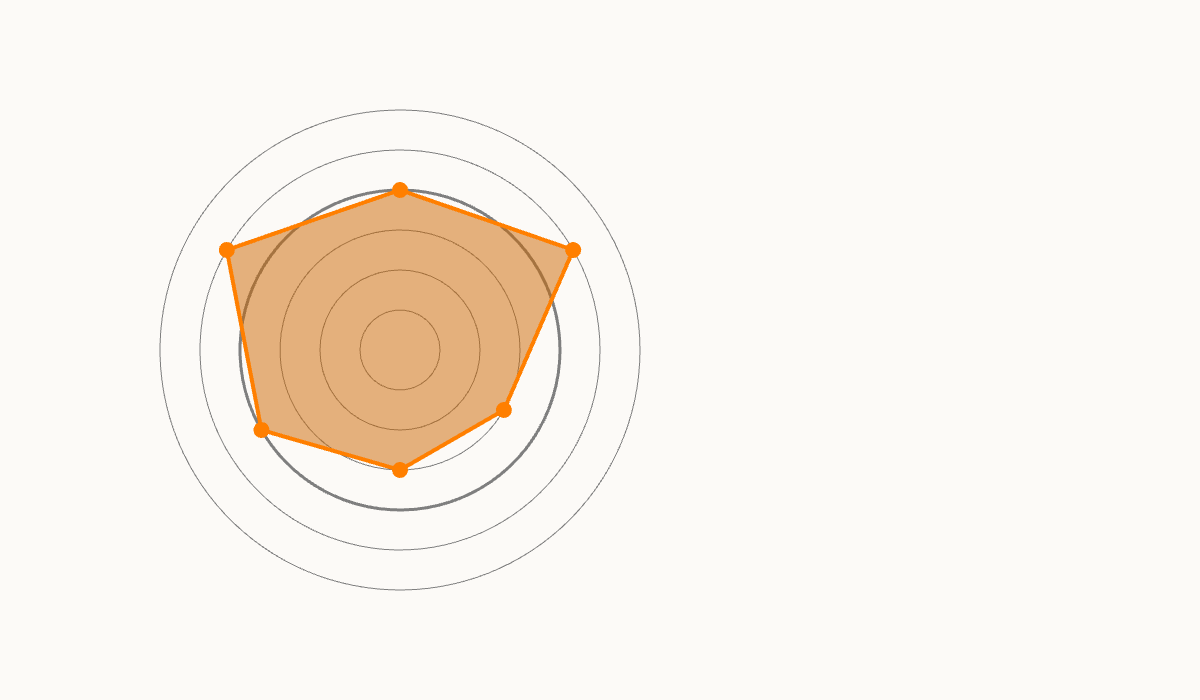
5. 多角形を描画する

- レーダーチャートの各点を結んだ多角形を描画します。
コード
# include <Siv3D.hpp>

/// @brief アイテム
struct Item
{
	/// @brief 都市の名前
	String city;

	/// @brief 世帯の人数
	double household = 0.0;

	/// @brief 1 世帯あたりの支出
	Array<double> perHousehold;

	/// @brief 1 人あたりの支出
	Array<double> perPerson;

	/// @brief 1 人あたりの支出(全国平均比)
	Array<double> perPersonRelative;
};

/// @brief レーダーチャートにおける点の座標の配列を返します。
/// @param values データ
/// @param radarCenter レーダーチャートの中心座標
/// @return レーダーチャートにおける点の座標の配列
Array<Vec2> GetPoints(const Array<double>& values, const Vec2& radarCenter)
{
	// 点の座標の配列
	Array<Vec2> points;

	for (int32 i = 0; i < values.size(); ++i)
	{
		// 角度(0 時の方向が 0 度、時計回り)
		const double angle = (i * (360_deg / values.size()));

		// 半径
		const double r = (160 * values[i]);

		// 角度と半径から点の座標を計算する
		const Vec2 pos = OffsetCircular{ radarCenter, r, angle };

		// 点の座標を配列に追加する
		points << pos;
	}

	return points;
}

void Main()
{
	// ウィンドウを 1200x700 にリサイズする
	Window::Resize(1200, 700);

	// 背景色を設定する
	Scene::SetBackground(ColorF{ 0.99, 0.98, 0.97 });

	// レーダーチャートの中心座標
	const Vec2 radarCenter{ 400, 350 };

	// 仮のアイテム
	const Item item{ U"札幌市", 1.0, { 100, 200, 300, 400, 500, 600 }, { 100, 200, 300, 400, 500, 600 }, { 1.0, 1.25, 0.75, 0.75, 1.0, 1.25 } };

	while (System::Update())
	{
		// レーダーチャートの円を描画する
		for (int32 i = 1; i <= 6; ++i)
		{
			if (i == 4)
			{
				// 100 % の円だけ太く描画する
				Circle{ radarCenter, (40 * i) }.drawFrame(3, ColorF{ 0.5 });
			}
			else
			{
				Circle{ radarCenter, (40 * i) }.drawFrame(1, ColorF{ 0.5 });
			}
		}

		// レーダーチャートのデータを描画する
		{
			// 札幌市のデータ
			const auto& values = item.perPersonRelative;

			// 点の座標の配列
			const Array<Vec2> points = GetPoints(values, radarCenter);

			// レーダーチャートの多角形
			const Polygon polygon{ points };

			// 多角形を描画する
			polygon.draw(ColorF{ 0.8, 0.4, 0.0, 0.5 });

			// 多角形の枠を描画する
			polygon.drawFrame(4, ColorF{ 1.0, 0.5, 0.0 });

			// 点を描画する
			for (const auto& p : points)
			{
				Circle{ p, 8 }.draw(ColorF{ 1.0, 0.5, 0.0 });
			}
		}
	}
}
6. データを CSV ファイルから読み込む
- CSV ファイルからデータを読み込む関数
LoadFromCSV()を作成します(途中まで)。 - CSV ファイルには無関係のデータも含まれているため、必要なデータが含まれるセルを指定して読み込みます。
コード
# include <Siv3D.hpp>

/// @brief アイテム
struct Item
{
	/// @brief 都市の名前
	String city;

	/// @brief 世帯の人数
	double household = 0.0;

	/// @brief 1 世帯あたりの支出
	Array<double> perHousehold;

	/// @brief 1 人あたりの支出
	Array<double> perPerson;

	/// @brief 1 人あたりの支出(全国平均比)
	Array<double> perPersonRelative;
};

/// @brief CSV ファイルからアイテムの配列を読み込みます。
/// @param path CSV ファイルのパス
/// @return アイテムの配列
Array<Item> LoadFromCSV(const FilePath& path)
{
	// CSV ファイルを読み込む
	const CSV csv{ path };

	if (not csv)
	{
		return{};
	}

	// アイテムの配列
	Array<Item> items;

	// 0 行目と 1 行目は無視し、2 行目から 50 行目までのデータを読み込む
	for (int32 y = 2; y < 50; ++y)
	{
		// 都市の名前
		const String city = csv[y][2];

		// 世帯の人数
		const double household = Parse<double>(csv[y][3]);

		// 各食品の 1 世帯当たりの支出
		const double d1 = Parse<double>(csv[y][5]);
		const double d2 = Parse<double>(csv[y][19]);
		const double d3 = Parse<double>(csv[y][55]);
		const double d4 = Parse<double>(csv[y][65]);
		const double d5 = Parse<double>(csv[y][73]);
		const double d6 = Parse<double>(csv[y][121]);

		Item item;
		item.city = city;
		item.household = household;
		item.perHousehold = { d1, d2, d3, d4, d5, d6 };

		// アイテムを配列に追加する
		items << item;
	}

	// ToDo

	return items;
}

/// @brief レーダーチャートにおける点の座標の配列を返します。
/// @param values データ
/// @param radarCenter レーダーチャートの中心座標
/// @return レーダーチャートにおける点の座標の配列
Array<Vec2> GetPoints(const Array<double>& values, const Vec2& radarCenter)
{
	// 点の座標の配列
	Array<Vec2> points;

	for (int32 i = 0; i < values.size(); ++i)
	{
		// 角度(0 時の方向が 0 度、時計回り)
		const double angle = (i * (360_deg / values.size()));

		// 半径
		const double r = (160 * values[i]);

		// 角度と半径から点の座標を計算する
		const Vec2 pos = OffsetCircular{ radarCenter, r, angle };

		// 点の座標を配列に追加する
		points << pos;
	}

	return points;
}

void Main()
{
	// ウィンドウを 1200x700 にリサイズする
	Window::Resize(1200, 700);

	// 背景色を設定する
	Scene::SetBackground(ColorF{ 0.99, 0.98, 0.97 });

	// レーダーチャートの中心座標
	const Vec2 radarCenter{ 400, 350 };

	// 仮のアイテム
	const Item item{ U"札幌市", 1.0, { 100, 200, 300, 400, 500, 600 }, { 100, 200, 300, 400, 500, 600 }, { 1.0, 1.25, 0.75, 0.75, 1.0, 1.25 } };

	while (System::Update())
	{
		// レーダーチャートの円を描画する
		for (int32 i = 1; i <= 6; ++i)
		{
			if (i == 4)
			{
				// 100 % の円だけ太く描画する
				Circle{ radarCenter, (40 * i) }.drawFrame(3, ColorF{ 0.5 });
			}
			else
			{
				Circle{ radarCenter, (40 * i) }.drawFrame(1, ColorF{ 0.5 });
			}
		}

		// レーダーチャートのデータを描画する
		{
			// 札幌市のデータ
			const auto& values = item.perPersonRelative;

			// 点の座標の配列
			const Array<Vec2> points = GetPoints(values, radarCenter);

			// レーダーチャートの多角形
			const Polygon polygon{ points };

			// 多角形を描画する
			polygon.draw(ColorF{ 0.8, 0.4, 0.0, 0.5 });

			// 多角形の枠を描画する
			polygon.drawFrame(4, ColorF{ 1.0, 0.5, 0.0 });

			// 点を描画する
			for (const auto& p : points)
			{
				Circle{ p, 8 }.draw(ColorF{ 1.0, 0.5, 0.0 });
			}
		}
	}
}
7. 目的のデータを計算する
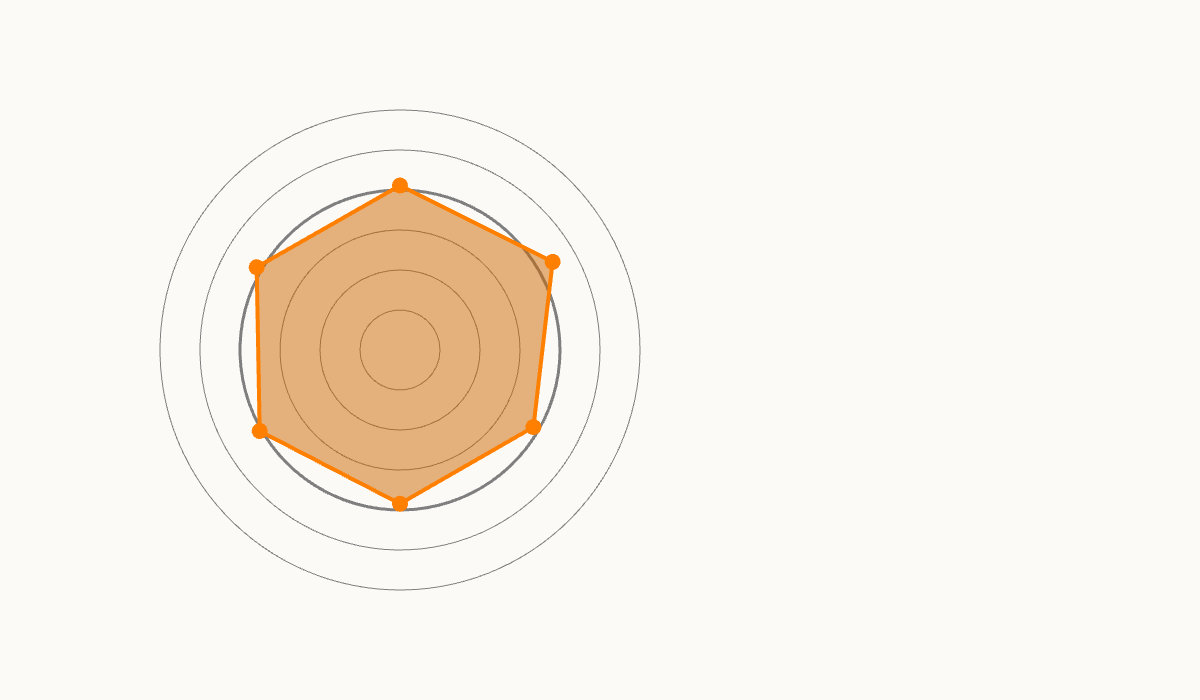
LoadFromCSV()内で「1 世帯当たりの支出」から「1 人あたりの支出」を計算し、さらに「1 人あたりの支出の全国平均比」を計算します。- 札幌市(
items[1])のデータをもとにレーダーチャートを描画します。
コード
# include <Siv3D.hpp>

/// @brief アイテム
struct Item
{
	/// @brief 都市の名前
	String city;

	/// @brief 世帯の人数
	double household = 0.0;

	/// @brief 1 世帯あたりの支出
	Array<double> perHousehold;

	/// @brief 1 人あたりの支出
	Array<double> perPerson;

	/// @brief 1 人あたりの支出(全国平均比)
	Array<double> perPersonRelative;
};

/// @brief CSV ファイルからアイテムの配列を読み込みます。
/// @param path CSV ファイルのパス
/// @return アイテムの配列
Array<Item> LoadFromCSV(const FilePath& path)
{
	// CSV ファイルを読み込む
	const CSV csv{ path };

	if (not csv)
	{
		return{};
	}

	// アイテムの配列
	Array<Item> items;

	// 0 行目と 1 行目は無視し、2 行目から 50 行目までのデータを読み込む
	for (int32 y = 2; y < 50; ++y)
	{
		// 都市の名前
		const String city = csv[y][2];

		// 世帯の人数
		const double household = Parse<double>(csv[y][3]);

		// 各食品の 1 世帯当たりの支出
		const double d1 = Parse<double>(csv[y][5]);
		const double d2 = Parse<double>(csv[y][19]);
		const double d3 = Parse<double>(csv[y][55]);
		const double d4 = Parse<double>(csv[y][65]);
		const double d5 = Parse<double>(csv[y][73]);
		const double d6 = Parse<double>(csv[y][121]);

		Item item;
		item.city = city;
		item.household = household;
		item.perHousehold = { d1, d2, d3, d4, d5, d6 };

		// アイテムを配列に追加する
		items << item;
	}

	// 各都市について
	for (auto& item : items)
	{
		item.perPerson = item.perHousehold;

		for (auto& perPerson : item.perPerson)
		{
			// 1 人あたりの支出を計算する
			perPerson /= item.household;
		}

		item.perPersonRelative = item.perPerson;

		for (size_t i = 0; auto& perPersonRelative : item.perPersonRelative)
		{
			// 全国平均 items[0] との比を計算する
			perPersonRelative /= items[0].perPerson[i];
			++i;
		}
	}

	return items;
}

/// @brief レーダーチャートにおける点の座標の配列を返します。
/// @param values データ
/// @param radarCenter レーダーチャートの中心座標
/// @return レーダーチャートにおける点の座標の配列
Array<Vec2> GetPoints(const Array<double>& values, const Vec2& radarCenter)
{
	// 点の座標の配列
	Array<Vec2> points;

	for (int32 i = 0; i < values.size(); ++i)
	{
		// 角度(0 時の方向が 0 度、時計回り)
		const double angle = (i * (360_deg / values.size()));

		// 半径
		const double r = (160 * values[i]);

		// 角度と半径から点の座標を計算する
		const Vec2 pos = OffsetCircular{ radarCenter, r, angle };

		// 点の座標を配列に追加する
		points << pos;
	}

	return points;
}

void Main()
{
	// ウィンドウを 1200x700 にリサイズする
	Window::Resize(1200, 700);

	// 背景色を設定する
	Scene::SetBackground(ColorF{ 0.99, 0.98, 0.97 });

	// レーダーチャートの中心座標
	const Vec2 radarCenter{ 400, 350 };

	// CSV ファイルからアイテムの配列を読み込む
	const Array<Item> items = LoadFromCSV(U"input1.csv");

	if (not items)
	{
		throw Error{ U"CSV ファイルの読み込みに失敗しました" };
	}

	while (System::Update())
	{
		// レーダーチャートの円を描画する
		for (int32 i = 1; i <= 6; ++i)
		{
			if (i == 4)
			{
				// 100 % の円だけ太く描画する
				Circle{ radarCenter, (40 * i) }.drawFrame(3, ColorF{ 0.5 });
			}
			else
			{
				Circle{ radarCenter, (40 * i) }.drawFrame(1, ColorF{ 0.5 });
			}
		}

		// レーダーチャートのデータを描画する
		{
			// 札幌市のデータ
			const auto& values = items[1].perPersonRelative;

			// 点の座標の配列
			const Array<Vec2> points = GetPoints(values, radarCenter);

			// レーダーチャートの多角形
			const Polygon polygon{ points };

			// 多角形を描画する
			polygon.draw(ColorF{ 0.8, 0.4, 0.0, 0.5 });

			// 多角形の枠を描画する
			polygon.drawFrame(4, ColorF{ 1.0, 0.5, 0.0 });

			// 点を描画する
			for (const auto& p : points)
			{
				Circle{ p, 8 }.draw(ColorF{ 1.0, 0.5, 0.0 });
			}
		}
	}
}
8. リストボックスを使う
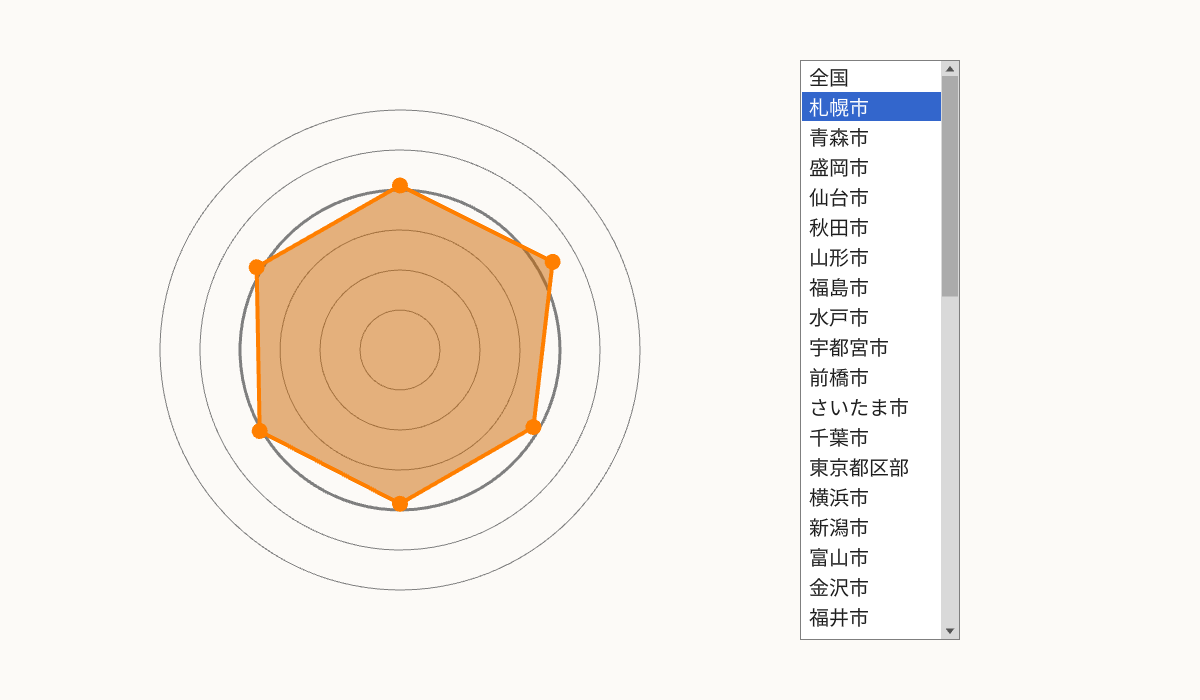
- Siv3D の GUI 機能「リストボックス」を使って、都市名を表示します。
Arrayのメンバ関数.map()を使って、都市名の配列Array<String>を作成し、リストボックスの項目一覧として設定します。- この時点では、リストボックスで都市を選択しても何も起こりませんが、次のステップで選択した都市のデータを表示するようにします。
コード
# include <Siv3D.hpp>

/// @brief アイテム
struct Item
{
	/// @brief 都市の名前
	String city;

	/// @brief 世帯の人数
	double household = 0.0;

	/// @brief 1 世帯あたりの支出
	Array<double> perHousehold;

	/// @brief 1 人あたりの支出
	Array<double> perPerson;

	/// @brief 1 人あたりの支出(全国平均比)
	Array<double> perPersonRelative;
};

/// @brief CSV ファイルからアイテムの配列を読み込みます。
/// @param path CSV ファイルのパス
/// @return アイテムの配列
Array<Item> LoadFromCSV(const FilePath& path)
{
	// CSV ファイルを読み込む
	const CSV csv{ path };

	if (not csv)
	{
		return{};
	}

	// アイテムの配列
	Array<Item> items;

	// 0 行目と 1 行目は無視し、2 行目から 50 行目までのデータを読み込む
	for (int32 y = 2; y < 50; ++y)
	{
		// 都市の名前
		const String city = csv[y][2];

		// 世帯の人数
		const double household = Parse<double>(csv[y][3]);

		// 各食品の 1 世帯当たりの支出
		const double d1 = Parse<double>(csv[y][5]);
		const double d2 = Parse<double>(csv[y][19]);
		const double d3 = Parse<double>(csv[y][55]);
		const double d4 = Parse<double>(csv[y][65]);
		const double d5 = Parse<double>(csv[y][73]);
		const double d6 = Parse<double>(csv[y][121]);

		Item item;
		item.city = city;
		item.household = household;
		item.perHousehold = { d1, d2, d3, d4, d5, d6 };

		// アイテムを配列に追加する
		items << item;
	}

	// 各都市について
	for (auto& item : items)
	{
		item.perPerson = item.perHousehold;

		for (auto& perPerson : item.perPerson)
		{
			// 1 人あたりの支出を計算する
			perPerson /= item.household;
		}

		item.perPersonRelative = item.perPerson;

		for (size_t i = 0; auto& perPersonRelative : item.perPersonRelative)
		{
			// 全国平均 items[0] との比を計算する
			perPersonRelative /= items[0].perPerson[i];
			++i;
		}
	}

	return items;
}

/// @brief レーダーチャートにおける点の座標の配列を返します。
/// @param values データ
/// @param radarCenter レーダーチャートの中心座標
/// @return レーダーチャートにおける点の座標の配列
Array<Vec2> GetPoints(const Array<double>& values, const Vec2& radarCenter)
{
	// 点の座標の配列
	Array<Vec2> points;

	for (int32 i = 0; i < values.size(); ++i)
	{
		// 角度(0 時の方向が 0 度、時計回り)
		const double angle = (i * (360_deg / values.size()));

		// 半径
		const double r = (160 * values[i]);

		// 角度と半径から点の座標を計算する
		const Vec2 pos = OffsetCircular{ radarCenter, r, angle };

		// 点の座標を配列に追加する
		points << pos;
	}

	return points;
}

void Main()
{
	// ウィンドウを 1200x700 にリサイズする
	Window::Resize(1200, 700);

	// 背景色を設定する
	Scene::SetBackground(ColorF{ 0.99, 0.98, 0.97 });

	// レーダーチャートの中心座標
	const Vec2 radarCenter{ 400, 350 };

	// CSV ファイルからアイテムの配列を読み込む
	const Array<Item> items = LoadFromCSV(U"input1.csv");

	if (not items)
	{
		throw Error{ U"CSV ファイルの読み込みに失敗しました" };
	}

	// 都市名からなるリストボックスを用意する
	ListBoxState listbox{ items.map([](const Item& item) { return item.city; }) };

	while (System::Update())
	{
		// リストボックスを描画する
		SimpleGUI::ListBox(listbox, Vec2{ 800, 60 }, 160, 580);

		// レーダーチャートの円を描画する
		for (int32 i = 1; i <= 6; ++i)
		{
			if (i == 4)
			{
				// 100 % の円だけ太く描画する
				Circle{ radarCenter, (40 * i) }.drawFrame(3, ColorF{ 0.5 });
			}
			else
			{
				Circle{ radarCenter, (40 * i) }.drawFrame(1, ColorF{ 0.5 });
			}
		}

		// レーダーチャートのデータを描画する
		{
			// 札幌市のデータ
			const auto& values = items[1].perPersonRelative;

			// 点の座標の配列
			const Array<Vec2> points = GetPoints(values, radarCenter);

			// レーダーチャートの多角形
			const Polygon polygon{ points };

			// 多角形を描画する
			polygon.draw(ColorF{ 0.8, 0.4, 0.0, 0.5 });

			// 多角形の枠を描画する
			polygon.drawFrame(4, ColorF{ 1.0, 0.5, 0.0 });

			// 点を描画する
			for (const auto& p : points)
			{
				Circle{ p, 8 }.draw(ColorF{ 1.0, 0.5, 0.0 });
			}
		}
	}
}
9. リストボックスで選択したアイテムのデータを使う
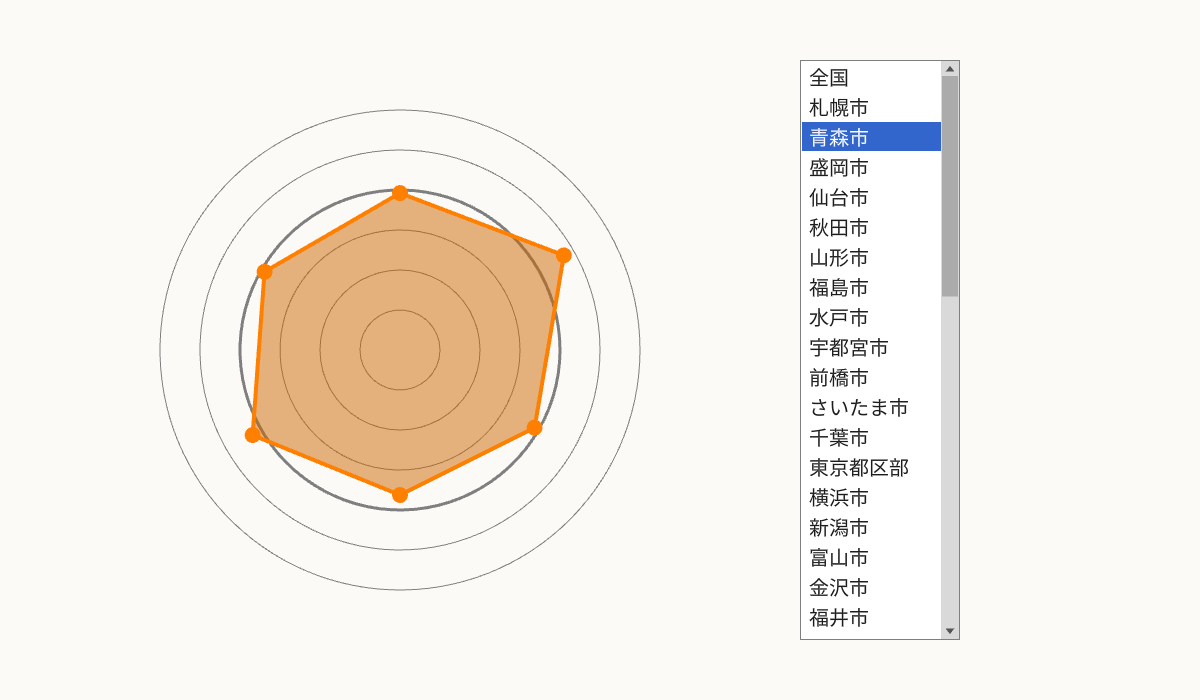
- リストボックスで選択した都市のデータを使って、レーダーチャートを描画します。
listbox.selectedItemIndex.value_or(0)は、リストボックスlistboxで選択されている項目のインデックスを返します。何も選択されていない場合は 0 を返します。
コード
# include <Siv3D.hpp>

/// @brief アイテム
struct Item
{
	/// @brief 都市の名前
	String city;

	/// @brief 世帯の人数
	double household = 0.0;

	/// @brief 1 世帯あたりの支出
	Array<double> perHousehold;

	/// @brief 1 人あたりの支出
	Array<double> perPerson;

	/// @brief 1 人あたりの支出(全国平均比)
	Array<double> perPersonRelative;
};

/// @brief CSV ファイルからアイテムの配列を読み込みます。
/// @param path CSV ファイルのパス
/// @return アイテムの配列
Array<Item> LoadFromCSV(const FilePath& path)
{
	// CSV ファイルを読み込む
	const CSV csv{ path };

	if (not csv)
	{
		return{};
	}

	// アイテムの配列
	Array<Item> items;

	// 0 行目と 1 行目は無視し、2 行目から 50 行目までのデータを読み込む
	for (int32 y = 2; y < 50; ++y)
	{
		// 都市の名前
		const String city = csv[y][2];

		// 世帯の人数
		const double household = Parse<double>(csv[y][3]);

		// 各食品の 1 世帯当たりの支出
		const double d1 = Parse<double>(csv[y][5]);
		const double d2 = Parse<double>(csv[y][19]);
		const double d3 = Parse<double>(csv[y][55]);
		const double d4 = Parse<double>(csv[y][65]);
		const double d5 = Parse<double>(csv[y][73]);
		const double d6 = Parse<double>(csv[y][121]);

		Item item;
		item.city = city;
		item.household = household;
		item.perHousehold = { d1, d2, d3, d4, d5, d6 };

		// アイテムを配列に追加する
		items << item;
	}

	// 各都市について
	for (auto& item : items)
	{
		item.perPerson = item.perHousehold;

		for (auto& perPerson : item.perPerson)
		{
			// 1 人あたりの支出を計算する
			perPerson /= item.household;
		}

		item.perPersonRelative = item.perPerson;

		for (size_t i = 0; auto& perPersonRelative : item.perPersonRelative)
		{
			// 全国平均 items[0] との比を計算する
			perPersonRelative /= items[0].perPerson[i];
			++i;
		}
	}

	return items;
}

/// @brief レーダーチャートにおける点の座標の配列を返します。
/// @param values データ
/// @param radarCenter レーダーチャートの中心座標
/// @return レーダーチャートにおける点の座標の配列
Array<Vec2> GetPoints(const Array<double>& values, const Vec2& radarCenter)
{
	// 点の座標の配列
	Array<Vec2> points;

	for (int32 i = 0; i < values.size(); ++i)
	{
		// 角度(0 時の方向が 0 度、時計回り)
		const double angle = (i * (360_deg / values.size()));

		// 半径
		const double r = (160 * values[i]);

		// 角度と半径から点の座標を計算する
		const Vec2 pos = OffsetCircular{ radarCenter, r, angle };

		// 点の座標を配列に追加する
		points << pos;
	}

	return points;
}

void Main()
{
	// ウィンドウを 1200x700 にリサイズする
	Window::Resize(1200, 700);

	// 背景色を設定する
	Scene::SetBackground(ColorF{ 0.99, 0.98, 0.97 });

	// レーダーチャートの中心座標
	const Vec2 radarCenter{ 400, 350 };

	// CSV ファイルからアイテムの配列を読み込む
	const Array<Item> items = LoadFromCSV(U"input1.csv");

	if (not items)
	{
		throw Error{ U"CSV ファイルの読み込みに失敗しました" };
	}

	// 都市名からなるリストボックスを用意する
	ListBoxState listbox{ items.map([](const Item& item) { return item.city; }) };

	while (System::Update())
	{
		// リストボックスを描画する
		SimpleGUI::ListBox(listbox, Vec2{ 800, 60 }, 160, 580);

		// レーダーチャートの円を描画する
		for (int32 i = 1; i <= 6; ++i)
		{
			if (i == 4)
			{
				// 100 % の円だけ太く描画する
				Circle{ radarCenter, (40 * i) }.drawFrame(3, ColorF{ 0.5 });
			}
			else
			{
				Circle{ radarCenter, (40 * i) }.drawFrame(1, ColorF{ 0.5 });
			}
		}

		// レーダーチャートのデータを描画する
		{
			// リストボックスで選択されている都市のデータ
			const auto& values = items[listbox.selectedItemIndex.value_or(0)].perPersonRelative;

			// 点の座標の配列
			const Array<Vec2> points = GetPoints(values, radarCenter);

			// レーダーチャートの多角形
			const Polygon polygon{ points };

			// 多角形を描画する
			polygon.draw(ColorF{ 0.8, 0.4, 0.0, 0.5 });

			// 多角形の枠を描画する
			polygon.drawFrame(4, ColorF{ 1.0, 0.5, 0.0 });

			// 点を描画する
			for (const auto& p : points)
			{
				Circle{ p, 8 }.draw(ColorF{ 1.0, 0.5, 0.0 });
			}
		}
	}
}
10. ラベルを描画する
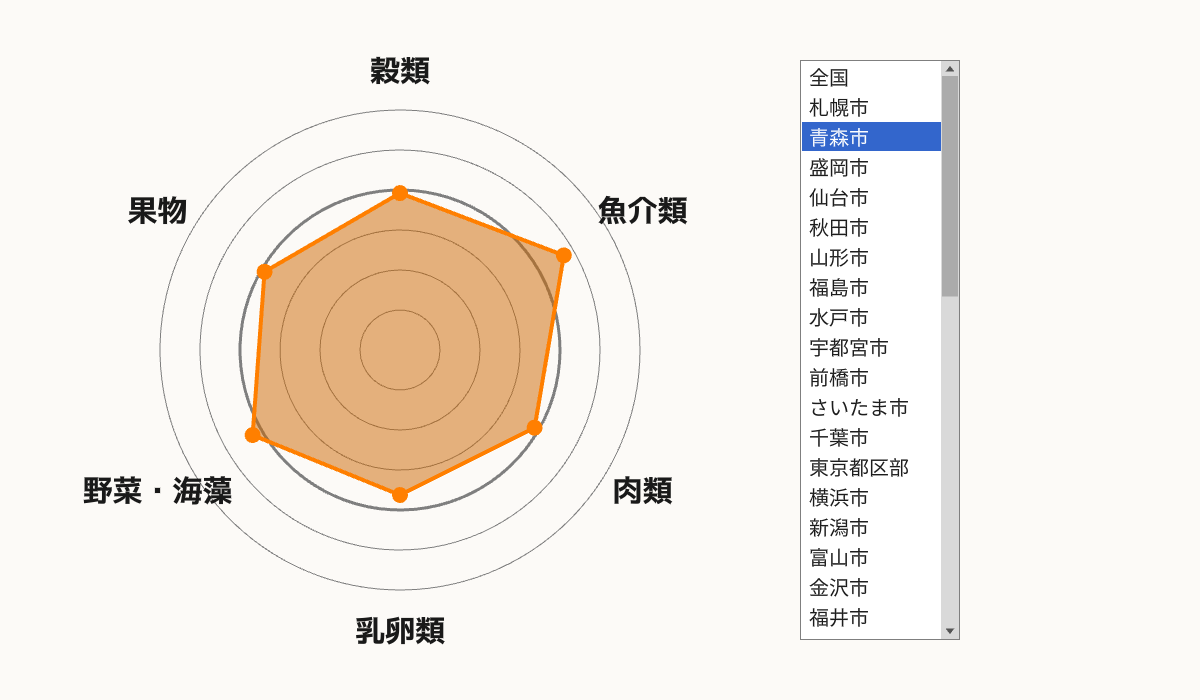
- レーダーチャートの各頂点にラベルを描画します。
コード
# include <Siv3D.hpp>

/// @brief アイテム
struct Item
{
	/// @brief 都市の名前
	String city;

	/// @brief 世帯の人数
	double household = 0.0;

	/// @brief 1 世帯あたりの支出
	Array<double> perHousehold;

	/// @brief 1 人あたりの支出
	Array<double> perPerson;

	/// @brief 1 人あたりの支出(全国平均比)
	Array<double> perPersonRelative;
};

/// @brief CSV ファイルからアイテムの配列を読み込みます。
/// @param path CSV ファイルのパス
/// @return アイテムの配列
Array<Item> LoadFromCSV(const FilePath& path)
{
	// CSV ファイルを読み込む
	const CSV csv{ path };

	if (not csv)
	{
		return{};
	}

	// アイテムの配列
	Array<Item> items;

	// 0 行目と 1 行目は無視し、2 行目から 50 行目までのデータを読み込む
	for (int32 y = 2; y < 50; ++y)
	{
		// 都市の名前
		const String city = csv[y][2];

		// 世帯の人数
		const double household = Parse<double>(csv[y][3]);

		// 各食品の 1 世帯当たりの支出
		const double d1 = Parse<double>(csv[y][5]);
		const double d2 = Parse<double>(csv[y][19]);
		const double d3 = Parse<double>(csv[y][55]);
		const double d4 = Parse<double>(csv[y][65]);
		const double d5 = Parse<double>(csv[y][73]);
		const double d6 = Parse<double>(csv[y][121]);

		Item item;
		item.city = city;
		item.household = household;
		item.perHousehold = { d1, d2, d3, d4, d5, d6 };

		// アイテムを配列に追加する
		items << item;
	}

	// 各都市について
	for (auto& item : items)
	{
		item.perPerson = item.perHousehold;

		for (auto& perPerson : item.perPerson)
		{
			// 1 人あたりの支出を計算する
			perPerson /= item.household;
		}

		item.perPersonRelative = item.perPerson;

		for (size_t i = 0; auto& perPersonRelative : item.perPersonRelative)
		{
			// 全国平均 items[0] との比を計算する
			perPersonRelative /= items[0].perPerson[i];
			++i;
		}
	}

	return items;
}

/// @brief レーダーチャートにおける点の座標の配列を返します。
/// @param values データ
/// @param radarCenter レーダーチャートの中心座標
/// @return レーダーチャートにおける点の座標の配列
Array<Vec2> GetPoints(const Array<double>& values, const Vec2& radarCenter)
{
	// 点の座標の配列
	Array<Vec2> points;

	for (int32 i = 0; i < values.size(); ++i)
	{
		// 角度(0 時の方向が 0 度、時計回り)
		const double angle = (i * (360_deg / values.size()));

		// 半径
		const double r = (160 * values[i]);

		// 角度と半径から点の座標を計算する
		const Vec2 pos = OffsetCircular{ radarCenter, r, angle };

		// 点の座標を配列に追加する
		points << pos;
	}

	return points;
}

void Main()
{
	// ウィンドウを 1200x700 にリサイズする
	Window::Resize(1200, 700);

	// 背景色を設定する
	Scene::SetBackground(ColorF{ 0.99, 0.98, 0.97 });

	// フォントを用意する
	const Font font{ FontMethod::MSDF, 40, Typeface::Bold };

	// レーダーチャートのラベル
	const Array<String> labels = { U"穀類", U"魚介類", U"肉類", U"乳卵類", U"野菜・海藻", U"果物" };

	// レーダーチャートの中心座標
	const Vec2 radarCenter{ 400, 350 };

	// CSV ファイルからアイテムの配列を読み込む
	const Array<Item> items = LoadFromCSV(U"input1.csv");

	if (not items)
	{
		throw Error{ U"CSV ファイルの読み込みに失敗しました" };
	}

	// 都市名からなるリストボックスを用意する
	ListBoxState listbox{ items.map([](const Item& item) { return item.city; }) };

	while (System::Update())
	{
		// リストボックスを描画する
		SimpleGUI::ListBox(listbox, Vec2{ 800, 60 }, 160, 580);

		// レーダーチャートの円を描画する
		for (int32 i = 1; i <= 6; ++i)
		{
			if (i == 4)
			{
				// 100 % の円だけ太く描画する
				Circle{ radarCenter, (40 * i) }.drawFrame(3, ColorF{ 0.5 });
			}
			else
			{
				Circle{ radarCenter, (40 * i) }.drawFrame(1, ColorF{ 0.5 });
			}
		}

		// レーダーチャートのデータを描画する
		{
			// リストボックスで選択されている都市のデータ
			const auto& values = items[listbox.selectedItemIndex.value_or(0)].perPersonRelative;

			// 点の座標の配列
			const Array<Vec2> points = GetPoints(values, radarCenter);

			// レーダーチャートの多角形
			const Polygon polygon{ points };

			// 多角形を描画する
			polygon.draw(ColorF{ 0.8, 0.4, 0.0, 0.5 });

			// 多角形の枠を描画する
			polygon.drawFrame(4, ColorF{ 1.0, 0.5, 0.0 });

			// 点を描画する
			for (const auto& p : points)
			{
				Circle{ p, 8 }.draw(ColorF{ 1.0, 0.5, 0.0 });
			}
		}

		// レーダーチャートのラベルを描画する
		for (int32 i = 0; i < labels.size(); ++i)
		{
			// 角度
			const double angle = (i * (360_deg / labels.size()));

			// ラベルの座標
			const Vec2 pos = OffsetCircular{ radarCenter, 280, angle };

			// ラベルを描画する
			font(labels[i]).drawAt(30, pos, ColorF{ 0.1 });
		}
	}
}
発展
ここから先は、自分で考えてレーダーチャートのプログラムを改良してみましょう。
機能のアイデア
- データの数字を表示する
- 2 つのアイテムを比較する
- より多くのデータを使ってレーダーチャートを描画する
- CSV に含まれるデータをもっと活用する
デザインのアイデア
- UI のサイズや配置をアレンジする
- 50%, 75%, 100% などの目盛りを表示する
- グラフのタイトルや説明を表示する
- 値が平均より顕著に異なる場合に強調する
チャレンジ
- 今回と同じデータか、インターネットから入手した別のデータを使って、新しいグラフを描画するプログラムを作成してみましょう。
- CSV ファイルを使う場合、事前に Excel などの表計算ソフトを使って UTF-8 形式の CSV ファイル として保存してください。