データ可視化のサンプル
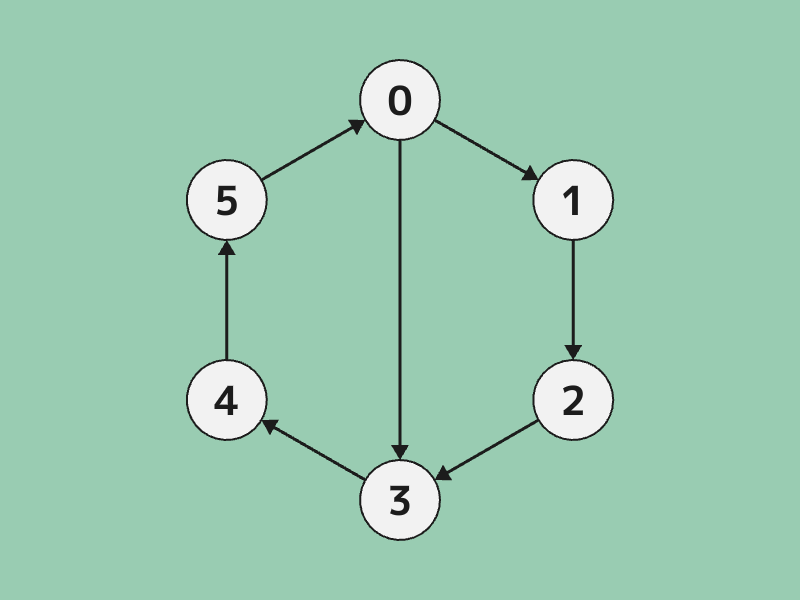
1. 有向グラフの描画
コード
# include <Siv3D.hpp>

using VertexID = int32;

struct Vertex
{
	String name;

	Vec2 pos;

	void draw() const
	{
		pos.asCircle(40).draw(ColorF{ 0.95 }).drawFrame(2, ColorF{ 0.11 });
	}

	void drawLabel(const Font& font) const
	{
		font(name).drawAt(40, pos, ColorF{ 0.11 });
	}
};

void DrawEdge(const Vertex& from, const Vertex& to)
{
	Line{ from.pos, to.pos }.stretched(-40).drawArrow(3, Vec2{ 15, 15 }, ColorF{ 0.11 });
}

void Main()
{
	Scene::SetBackground(ColorF{ 0.6, 0.8, 0.7 });

	const Font font{ FontMethod::MSDF, 36, Typeface::Bold };

	Array<Array<VertexID>> graph(6);
	graph[0] = { 1, 3 };
	graph[1] = { 2 };
	graph[2] = { 3 };
	graph[3] = { 4 };
	graph[4] = { 5 };
	graph[5] = { 0 };

	Array<Vertex> vertices;

	for (size_t i = 0; i < graph.size(); ++i)
	{
		const double rad = (i * (Math::TwoPi / graph.size()));
		vertices.push_back(Vertex{ Format(i), OffsetCircular{ Scene::Center(), 200, rad } });
	}

	while (System::Update())
	{
		for (const auto& v : vertices)
		{
			v.draw();
		}

		for (size_t from = 0; from < graph.size(); ++from)
		{
			for (const auto& to : graph[from])
			{
				DrawEdge(vertices[from], vertices[to]);
			}
		}

		for (const auto& v : vertices)
		{
			v.drawLabel(font);
		}
	}
}
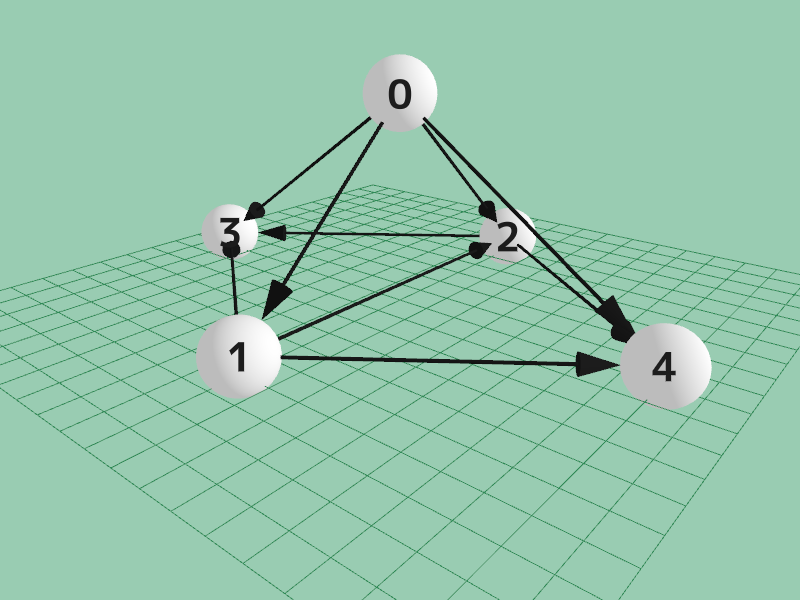
2. 有向グラフの描画(3D)
コード
# include <Siv3D.hpp>

using VertexID = int32;

struct Vertex
{
	String name;

	Vec3 pos;

	void draw() const
	{
		Sphere{ pos, 1 }.draw();
	}

	void drawLabel(const Font& font, const BasicCamera3D& camera) const
	{
		font(name).drawAt(40, camera.worldToScreenPoint(pos).xy(), ColorF{ 0.11 });
	}
};

void DrawEdge(const Vertex& from, const Vertex& to)
{
	const Vec3 dir = (to.pos - from.pos).normalized();
	Cylinder{ from.pos, (to.pos - dir * 2.0), 0.05 }.draw(ColorF{ 0.11 }.removeSRGBCurve());
	Cone{ (to.pos - dir * 2.0), (to.pos - dir * 1.0), 0.3 }.draw(ColorF{ 0.11 }.removeSRGBCurve());
}

void Main()
{
	const Font font{ FontMethod::MSDF, 36, Typeface::Bold };
	const ColorF BackgroundColor = ColorF{ 0.6, 0.8, 0.7 }.removeSRGBCurve();
	const MSRenderTexture renderTexture{ Scene::Size(), TextureFormat::R8G8B8A8_Unorm_SRGB, HasDepth::Yes };
	constexpr Vec3 focusPosition{ 0, 0, 0 };
	Vec3 eyePosition{ 0, 10, 0 };
	BasicCamera3D camera{ renderTexture.size(), 45_deg, eyePosition, focusPosition};

	Graphics3D::SetSunColor(ColorF{ 0.5 });
	Graphics3D::SetGlobalAmbientColor(ColorF{ 0.5 });

	Array<Array<VertexID>> graph(5);
	graph[0] = { 1, 2, 3, 4 };
	graph[1] = { 2, 3, 4 };
	graph[2] = { 3, 4 };

	const Array<Vertex> vertices =
	{
		{ U"0", Vec3{ 0, 6, 0 } },
		{ U"1", Vec3{ -6, 0.5, 0 } },
		{ U"2", Vec3{ 6, 0.5, 0 } },
		{ U"3", Vec3{ 0, 0.5, 8 } },
		{ U"4", Vec3{ 0, 0.5, -8 } },
	};

	while (System::Update())
	{
		// カメラを更新する
		{
			eyePosition = Cylindrical{ 20, Scene::Time() * 30_deg, 8 + Periodic::Sine0_1(4s) * 8 };
			camera.setView(eyePosition, focusPosition);
			Graphics3D::SetCameraTransform(camera);
		}

		{
			const ScopedRenderTarget3D target{ renderTexture.clear(BackgroundColor) };

			for (auto i : Range(-10, 10))
			{
				Line3D{ Vec3{ -10, 0, i }, Vec3{ 10, 0, i } }.draw(Linear::Palette::Seagreen);
				Line3D{ Vec3{ i, 0, -10 }, Vec3{ i, 0, 10 } }.draw(Linear::Palette::Seagreen);
			}

			for (size_t from = 0; from < graph.size(); ++from)
			{
				for (const auto& to : graph[from])
				{
					DrawEdge(vertices[from], vertices[to]);
				}
			}

			for (const auto& v : vertices)
			{
				v.draw();
			}
		}

		// 3D シーンを 2D シーンに描画
		{
			Graphics3D::Flush();
			renderTexture.resolve();
			Shader::LinearToScreen(renderTexture);
		}

		{
			const Mat4x4 mat = camera.getMat4x4();

			for (const auto& v : vertices)
			{
				v.drawLabel(font, camera);
			}
		}
	}
}
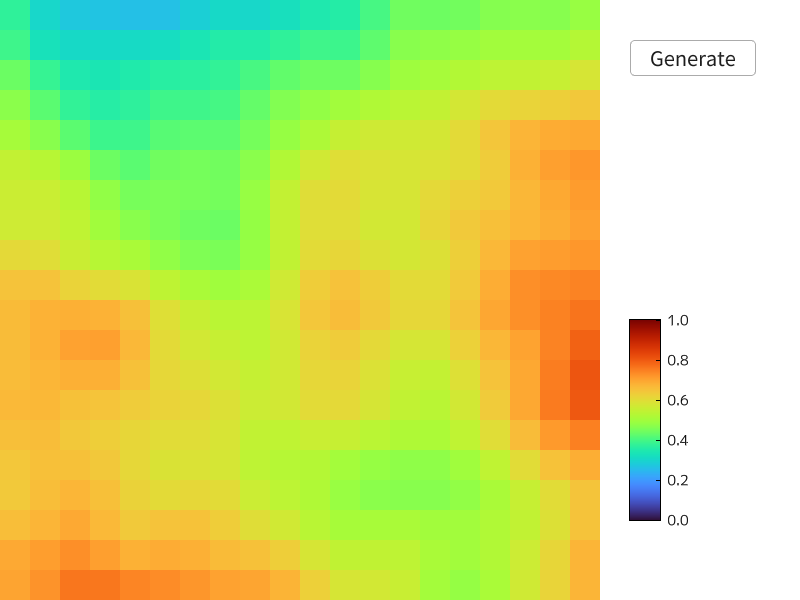
3. 二次元のヒートマップ
コード
# include <Siv3D.hpp>

Grid<double> GenerateGrid()
{
	Grid<double> grid(20, 20);

	PerlinNoise perlin{ RandomUint64() };

	for (int32 y = 0; y < grid.height(); ++y)
	{
		for (int32 x = 0; x < grid.width(); ++x)
		{
			grid[y][x] = perlin.octave2D0_1((x / 24.0), (y / 24.0), 4);
		}
	}

	return grid;
}

Image ToImage(const Grid<double>& grid, ColormapType colormapType)
{
	Image image(grid.size());

	for (int32 y = 0; y < grid.height(); ++y)
	{
		for (int32 x = 0; x < grid.width(); ++x)
		{
			const double value = grid[y][x];

			image[y][x] = Colormap01(value, colormapType);
		}
	}

	return image;
}

Image MakeColorBar(ColormapType colormapType)
{
	Image image{ 1, 256 };

	for (int32 y = 0; y < image.height(); ++y)
	{
		const double value = (1.0 - y / 255.0);
		image[y][0] = Colormap01(value, colormapType);
	}

	return image;
}

void Main()
{
	Scene::SetBackground(Palette::White);

	const Font font{ FontMethod::MSDF, 36 };

	constexpr int32 CellSize = 30;;

	constexpr ColormapType ColorType = ColormapType::Turbo;

	const Texture colorBar{ MakeColorBar(ColorType), TextureDesc::Mipped };

	Grid<double> grid = GenerateGrid();

	DynamicTexture texture{ ToImage(grid, ColorType) };

	while (System::Update())
	{
		// データを再生成する
		if (SimpleGUI::Button(U"Generate", Vec2{ 630, 40 }))
		{
			grid = GenerateGrid();

			texture.fill(ToImage(grid, ColorType));
		}

		// ヒートマップを表示する
		{
			const ScopedRenderStates2D sampler{ SamplerState::ClampNearest };

			texture.scaled(CellSize).draw();
		}

		// ヒートマップ上で値を表示する
		{
			const Point index = (Cursor::Pos() / CellSize);

			if (InRange(index.x, 0, (static_cast<int32>(grid.width()) - 1))
				&& InRange(index.y, 0, (static_cast<int32>(grid.height()) - 1)))
			{
				const double value = grid[index.y][index.x];

				Rect{ (index * CellSize), CellSize }.drawFrame(2);

				PutText(U"{:.3f}"_fmt(value), Arg::leftCenter = Cursor::Pos().movedBy(20, 0));
			}
		}

		// カラーバーを表示する
		{
			const Rect colorBarRect{ 630, 320, 30, 200 };

			const int32 step = ((colorBarRect.h) / 10);

			colorBarRect(colorBar).draw().drawFrame(0, 1, Palette::Black);

			for (int32 i = 0; i <= 10; i += 2)
			{
				Rect{ (colorBarRect.rightX() - 4), (colorBarRect.y + (i * step)), 4, 1 }.draw(Palette::Black);
			}

			for (int32 i = 0; i <= 10; i += 2)
			{
				font(U"{:.1f}"_fmt(1.0 - i / 10.0)).drawAt(14, Vec2{ (colorBarRect.rightX() + 18), (colorBarRect.y + (i * step)) }, Palette::Black);
			}
		}
	}
}
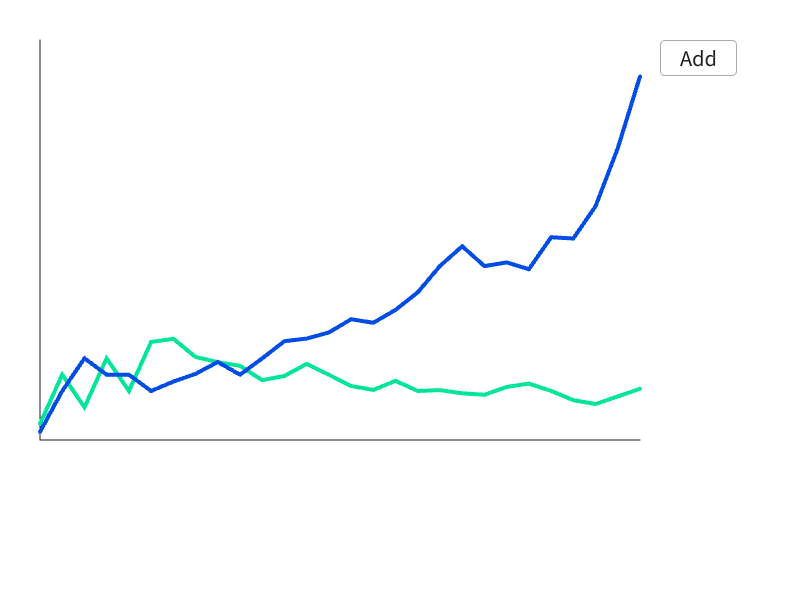
4. 折れ線グラフ
コード
# include <Siv3D.hpp>

void DrawLineGraph(const Rect& graphArea, const Array<double>& values, double maxValue, const ColorF& color, double thickness)
{
	const double xStep = (graphArea.w / (values.size() - 1.0));
	const double yStep = (graphArea.h / maxValue);

	LineString lines;

	for (size_t i = 0; i < values.size(); ++i)
	{
		const double x = (graphArea.x + xStep * i);
		const double y = (graphArea.y + graphArea.h - yStep * values[i]);

		lines << Vec2{ x, y };
	}

	lines.draw(LineStyle::RoundCap, thickness, color);
}

void Main()
{
	Scene::SetBackground(Palette::White);

	const Rect graphArea{ 40, 40, 600, 400 };

	Array<double> valuesA = { 10, 40, 20, 50, 30, 60 };
	Array<double> valuesB = { 5, 30, 50, 40, 40, 30 };

	while (System::Update())
	{
		if (SimpleGUI::Button(U"Add", Vec2{ 660, 40 }))
		{
			valuesA << (valuesA.back() * Random(0.8, 1.25));
			valuesB << (valuesB.back() * Random(0.8, 1.25));
		}

		graphArea.left().draw(ColorF{ 0.11 });
		graphArea.bottom().draw(ColorF{ 0.11 });

		const double maxValue = Max(*std::max_element(valuesA.begin(), valuesA.end())
			, *std::max_element(valuesB.begin(), valuesB.end())) * 1.1;

		DrawLineGraph(graphArea, valuesA, maxValue, HSV{ 160, 1.0, 0.9 }, 4);
		DrawLineGraph(graphArea, valuesB, maxValue, HSV{ 220, 1.0, 0.9 }, 4);
	}
}
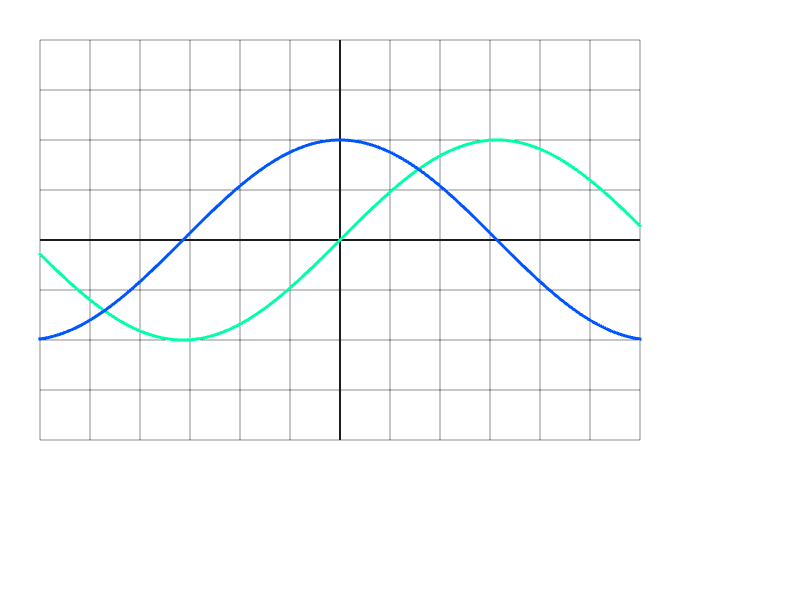
5. 関数グラフ
コード
# include <Siv3D.hpp>

void ToLineString(const Array<double>& values, const Vec2& start, LineString& ls, double yScale)
{
	ls.resize(values.size());

	for (size_t i = 0; i < values.size(); ++i)
	{
		ls[i] = (start + Vec2{ i, (values[i] * -yScale) });
	}
}

void Main()
{
	Scene::SetBackground(Palette::White);

	constexpr size_t N = 600;
	const Rect graphArea{ 40, 40, N, 400 };

	const double xStart = -3.00;
	const double xEnd = 3.0;
	const double xStep = ((xEnd - xStart) / graphArea.w);

	Array<double> valuesA(N + 1);
	Array<double> valuesB(N + 1);
	for (size_t i = 0; i < (N + 1); ++i)
	{
		const double x = (xStart + xStep * i);
		valuesA[i] = Math::Sin(x);
		valuesB[i] = Math::Cos(x);
	}

	const double yStart = -2.0;
	const double yEnd = 2.0;
	const double yStep = ((yEnd - yStart) / graphArea.h);

	LineString lsA(N + 1), lsB(N + 1);
	ToLineString(valuesA, graphArea.leftCenter(), lsA, (1.0 / yStep));
	ToLineString(valuesB, graphArea.leftCenter(), lsB, (1.0 / yStep));

	const double xAxisStep = 0.5;
	const double yAxisStep = 0.5;

	while (System::Update())
	{
		for (int32 x = static_cast<int32>(xStart / xAxisStep); x <= static_cast<int32>(xEnd / xAxisStep); ++x)
		{
			const double xAxis = (graphArea.x + (x * xAxisStep - xStart) / xStep);
			const double thickness = ((x == 0) ? 2.0 : 0.3);
			RectF{ Arg::topCenter(xAxis, graphArea.y), thickness, static_cast<double>(graphArea.h) }.draw(ColorF{ 0.11 });
		}

		for (int32 y = static_cast<int32>(yStart / yAxisStep); y <= static_cast<int32>(yEnd / yAxisStep); ++y)
		{
			const double yAxis = (graphArea.y + (y * yAxisStep - yStart) / yStep);
			const double thickness = ((y == 0) ? 2.0 : 0.3);
			RectF{ Arg::leftCenter(graphArea.x, yAxis), static_cast<double>(graphArea.w), thickness }.draw(ColorF{ 0.11 });
		}

		lsA.draw(3, HSV{ 160 });
		lsB.draw(3, HSV{ 220 });
	}
}
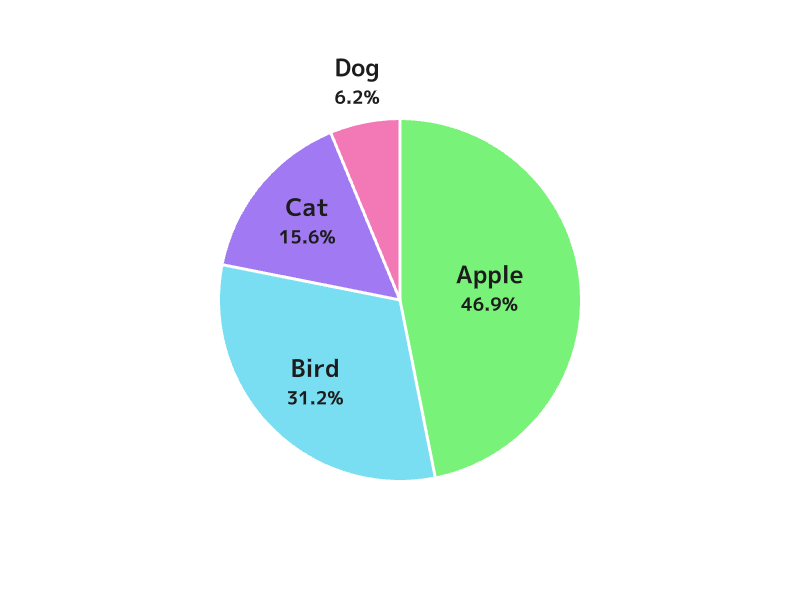
6. 円グラフ
コード
# include <Siv3D.hpp>

Array<double> ToRatios(const Array<double>& values)
{
	const double sum = values.sumF();

	Array<double> ratios;

	for (const auto& value : values)
	{
		ratios << (value / sum);

	}
	return ratios;
}

Array<double> CumulativeSum(const Array<double>& values)
{
	Array<double> sums = { 0.0 };

	for (const auto& value : values)
	{
		sums << (sums.back() + value);
	}

	return sums;
}

void Main()
{
	Scene::SetBackground(Palette::White);

	const Font font{ FontMethod::MSDF, 48, Typeface::Bold };

	// ラベル
	const Array<String> labels = { U"Apple", U"Bird", U"Cat", U"Dog" };

	// 数値
	const Array<double> values = { 15.0, 10.0, 5.0, 2.0 };

	// 円グラフで占める割合
	const Array<double> ratios = ToRatios(values);

	// 円グラフの開始位置(割合)
	const Array<double> starts = CumulativeSum(ratios);

	const Circle circle{ Scene::Center(), 180.0 };

	while (System::Update())
	{
		// 円グラフを描画する
		for (size_t i = 0; i < values.size(); ++i)
		{
			const double startAngle = (starts[i] * 360_deg);
			const double angle = (ratios[i] * 360_deg);
			circle.drawPie(startAngle, angle, HSV{(120 + 70 * i), 0.5, 0.95});
		}

		// 境界線を描画する
		for (size_t i = 0; i < values.size(); ++i)
		{
			const double startAngle = (starts[i] * 360_deg);
			Line{ circle.center, Arg::angle = startAngle, circle.r }.draw(3);
		}

		// ラベルを描画する
		for (size_t i = 0; i < values.size(); ++i)
		{
			const double startAngle = (starts[i] * 360_deg);
			const double angle = (ratios[i] * 360_deg);
			const double midAngle = (startAngle + angle / 2.0);

			// 割合に応じてラベルの位置を調整する
			const Vec2 pos = OffsetCircular{ circle.center, ((ratios[i] < 0.1) ? 220.0 : (ratios[i] < 0.4) ? 120.0 : 90.0), midAngle };

			font(labels[i]).draw(24, Arg::bottomCenter = pos, ColorF{ 0.11 });
			font(U"{:.1f}%"_fmt(ratios[i] * 100.0)).draw(18, Arg::topCenter = pos, ColorF{ 0.11 });
		}
	}
}
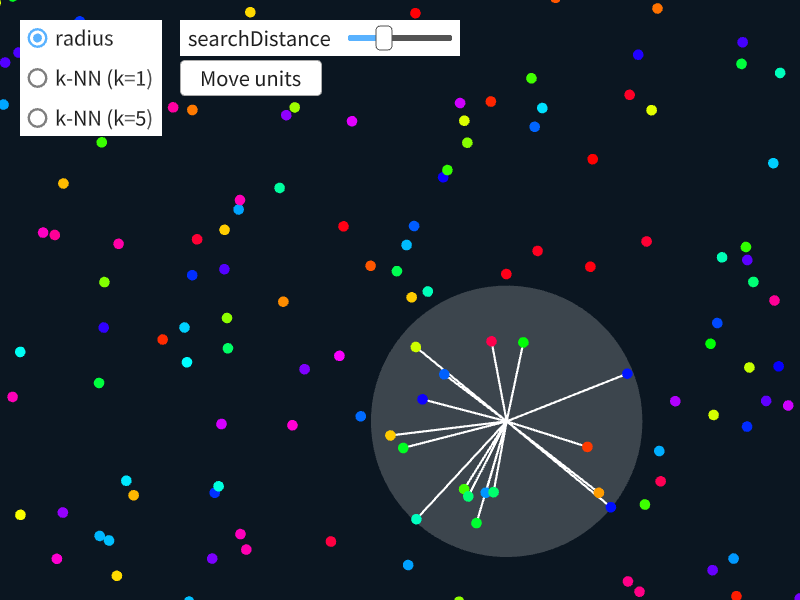
7. kd 木
コード
# include <Siv3D.hpp>

struct Unit
{
	Circle circle;

	ColorF color;

	void draw() const
	{
		circle.draw(color);
	}
};

// Unit を KDTree で扱えるようにするためのアダプタ
struct UnitAdapter : KDTreeAdapter<Array<Unit>, Vec2>
{
	static const element_type* GetPointer(const point_type& point)
	{
		return point.getPointer();
	}

	static element_type GetElement(const dataset_type& dataset, size_t index, size_t dim)
	{
		return dataset[index].circle.center.elem(dim);
	}
};

void Main()
{
	// 4000 個の Unit を生成する
	Array<Unit> units;
	for (size_t i = 0; i < 4000; ++i)
	{
		const Unit unit
		{
			.circle = Circle{ RandomVec2(Circle{100}), 0.25 },
			.color = RandomColorF(),
		};

		units << unit;
	}

	// kd-tree を構築する
	KDTree<UnitAdapter> kdTree{ units };

	// 探索の種類(ラジオボタンのインデックス)
	size_t searchTypeIndex = 0;

	// radius search する際の探索距離
	double searchDistance = 4.0;

	// 2D カメラ
	Camera2D camera{ Vec2{ 0, 0 }, 24.0 };

	while (System::Update())
	{
		// 2D カメラを更新する
		camera.update();

		// 画面内のユニットだけ処理するための基準の長方形
		const RectF viewRect = camera.getRegion();
		const RectF viewRectScaled = viewRect.scaledAt(viewRect.center(), 1.2);
		{
			const auto transformer = camera.createTransformer();

			const Vec2 cursorPos = Cursor::PosF();

			if (searchTypeIndex == 0) // radius search
			{
				Circle{ cursorPos, searchDistance }.draw(ColorF{ 1.0, 0.2 });

				// searchDistance 以内の距離にある Unit のインデックスを取得
				for (auto index : kdTree.radiusSearch(cursorPos, searchDistance))
				{
					Line{ cursorPos, units[index].circle.center }.draw(0.1);
				}
			}
			else // k-NN search
			{
				const size_t k = ((searchTypeIndex == 1) ? 1 : 5);

				// 最も近い k 個の Unit のインデックスを取得
				for (auto index : kdTree.knnSearch(k, cursorPos))
				{
					Line{ cursorPos, units[index].circle.center }.draw(0.1);
				}
			}

			// ユニットを描画する
			for (const auto& unit : units)
			{
				// 描画負荷削減のため、画面内 (viewRectScaled) に無ければスキップする
				if (not unit.circle.center.intersects(viewRectScaled))
				{
					continue;
				}

				unit.draw();
			}
		}

		SimpleGUI::RadioButtons(searchTypeIndex, { U"radius", U"k-NN (k=1)", U"k-NN (k=5)" }, Vec2{ 20, 20 });
		SimpleGUI::Slider(U"searchDistance", searchDistance, 0.0, 20.0, Vec2{ 180, 20 }, 160, 120, (searchTypeIndex == 0));
		if (SimpleGUI::Button(U"Move units", Vec2{ 180, 60 }))
		{
			// Unit をランダムに移動する
			for (auto& unit : units)
			{
				unit.circle.moveBy(RandomVec2(0.5));
			}

			// Unit の座標が更新されたので kd-tree を再構築する
			kdTree.rebuildIndex();
		}

		camera.draw(Palette::Orange);
	}
}
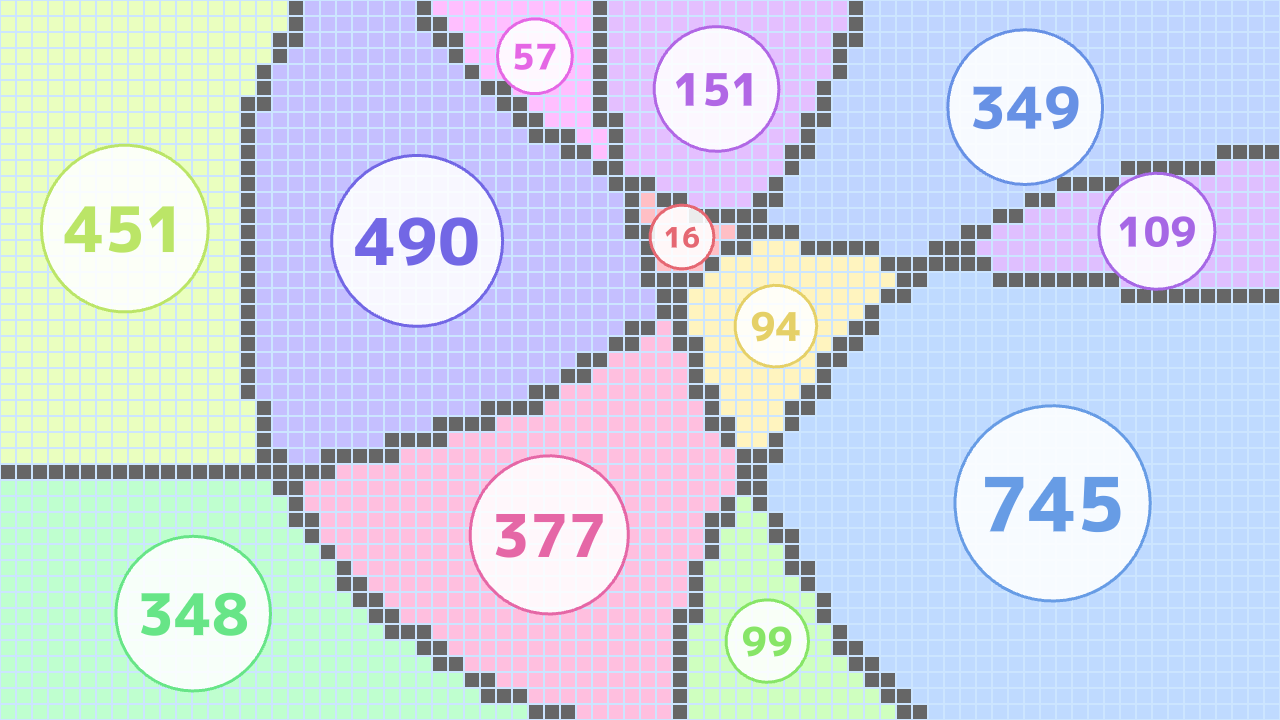
8. DisjointSet
コード
# include <Siv3D.hpp>

void Main()
{
	Window::Resize(1280, 720);
	Scene::SetBackground(ColorF{ 0.8, 0.9, 1.0 });

	// フォント
	const Font font{ FontMethod::MSDF, 48, Typeface::Heavy };

	// セルの大きさ
	constexpr int32 CellSize = 16;

	// マス目の数
	constexpr Size GridSize{ 1280 / CellSize, 720 / CellSize };

	// 塗りつぶし (白: true, 黒: false)
	Grid<bool> grid(GridSize, true);

	// Disjoint Set (Union-Find)
	DisjointSet<int32> ds{ GridSize.x* GridSize.y };

	// 現在存在する領域の root と, 領域の座標の合計値 (中心計算用)
	HashTable<int32, Vec2> currentRoots;

	// root の番号と色 (hue) の対応表
	HashTable<int32, int32> globalColorTable;
	int32 colorIndex = 0;

	// UnionFind を更新する必要があるか
	bool isDirty = true;

	while (System::Update())
	{
		if (isDirty)
		{
			// Disjoint Set を更新する
			{
				ds.reset();

				for (int32 y = 0; y < GridSize.y; ++y)
				{
					for (int32 x = 0; x < GridSize.x; ++x)
					{
						if (grid[y][x])
						{
							const int32 index = (y * GridSize.x + x);

							if (int32 nx = (x + 1); nx < GridSize.x)
							{
								if (grid[y][nx])
								{
									ds.merge(index, index + 1);
								}
							}

							if (int32 ny = (y + 1); ny < GridSize.y)
							{
								if (grid[ny][x])
								{
									ds.merge(index, (index + GridSize.x));
								}
							}
						}
					}
				}
			}

			// 存在する root 一覧を作成する
			{
				currentRoots.clear();

				for (int32 y = 0; y < GridSize.y; ++y)
				{
					for (int32 x = 0; x < GridSize.x; ++x)
					{
						if (grid[y][x])
						{
							const int32 index = (y * GridSize.x + x);
							const int32 root = ds.find(index);
							const Vec2 pos{ x, y };

							if (auto it = currentRoots.find(root); it == currentRoots.end())
							{
								currentRoots.emplace(root, pos);
							}
							else
							{
								it->second += pos;
							}
						}
					}
				}
			}

			// root と色の対応表を更新する
			{
				for (auto& currentRoot : currentRoots)
				{
					if (not globalColorTable.contains(currentRoot.first))
					{
						globalColorTable.emplace(currentRoot.first, (colorIndex++ * 55));
					}
				}

				EraseNodes_if(globalColorTable, [&](const auto& p) { return (not currentRoots.contains(p.first)); });
			}

			isDirty = false;
		}

		// すべてのマスを描画する
		for (auto p : step(GridSize))
		{
			const Rect rect = Rect{ (p * CellSize), CellSize }.stretched(-1);

			if (grid[p])
			{
				const int32 index = (p.y * GridSize.x + p.x);
				const int32 root = ds.find(index);
				rect.draw(HSV{ globalColorTable[root], 0.25, 1.0 });
			}
			else
			{
				rect.draw(ColorF{ 0.4 });
			}
		}

		// クリックされたらマスの状態を更新する
		if ((MouseL | MouseR).pressed())
		{
			const Point pos = (Cursor::Pos() / CellSize);

			if (InRange(pos.x, 0, (GridSize.x - 1))
				&& InRange(pos.y, 0, (GridSize.y - 1)))
			{
				const bool old = grid[pos];
				grid[pos] = MouseL.pressed() ? false : true;
				isDirty = (old != grid[pos]);
			}
		}

		// 領域の情報を表示する
		for (const auto& currentRoot : currentRoots)
		{
			const int32 root = currentRoot.first;
			const int32 size = static_cast<int32>(ds.size(root));
			const Vec2 center = currentRoot.second / size;
			const HSV textColor = HSV{ globalColorTable[root], 0.55, 0.9 };
			const Vec2 pos = (center * CellSize) + (Vec2::All(CellSize) * 0.5);
			const double fontSize = (20 + 2 * Sqrt(size));
			const double w = font(size).region(fontSize).w;

			Circle{ pos, (w / 1.66 + 10) }.draw(ColorF{ 1.0, 0.88 }).drawFrame(3, textColor);
			font(size).drawAt(fontSize, pos, textColor);
		}
	}
}
9. DisjointSet による画像の塗りつぶし領域の検出
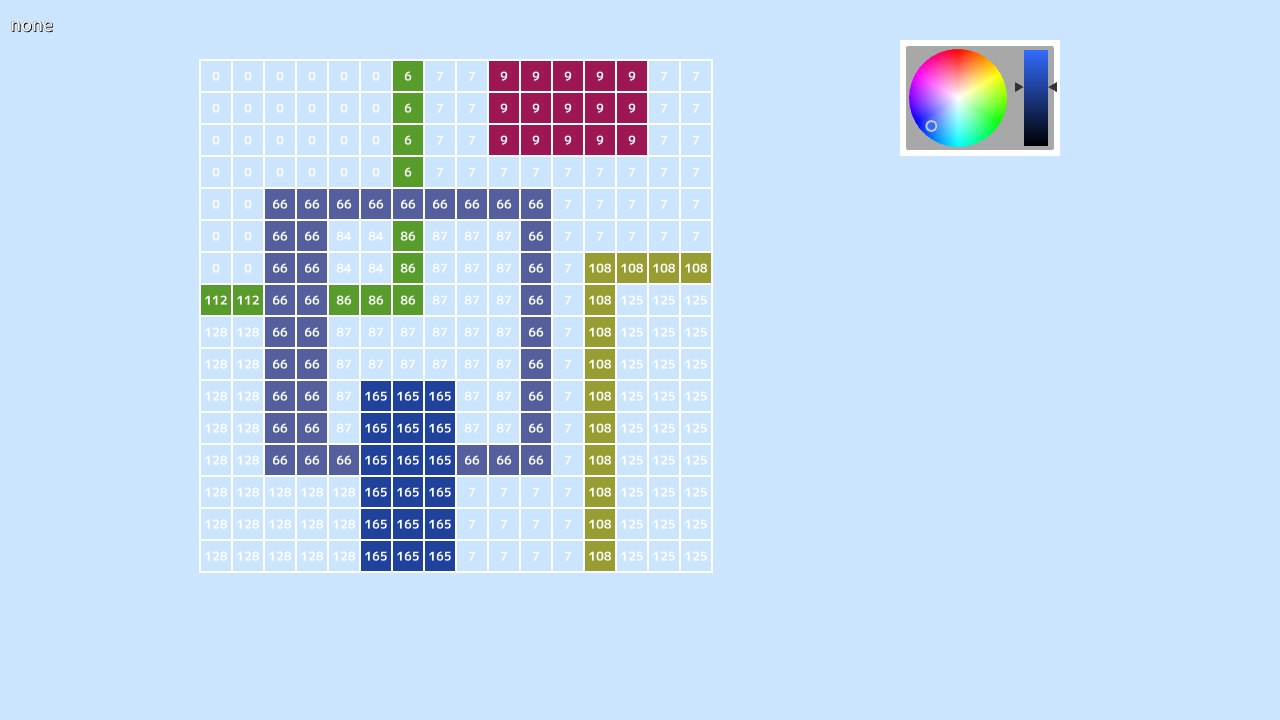
コード
# include <Siv3D.hpp>

// グループ情報を構築する関数
void RebuildGroup(DisjointSet<int32>& ds, const Image& image)
{
	assert(ds.size() == image.num_pixels());
	ds.reset();

	for (int32 y = 0; y < image.height(); ++y)
	{
		for (int32 x = 0; x < image.width(); ++x)
		{
			const int32 i = (y * image.width() + x);

			if ((x + 1) < image.width())
			{
				if (image[y][x] == image[y][x + 1]) // 右隣のピクセルと同じ色なら
				{
					ds.merge(i, (i + 1)); // グループ化
				}
			}

			if ((y + 1) < image.height())
			{
				if (image[y][x] == image[y + 1][x]) // 下のピクセルと同じ色なら
				{
					ds.merge(i, (i + image.width())); // グループ化
				}
			}
		}
	}
}

[[nodiscard]]
Optional<Point> GetPixelIndexFromCursorPos(const Size& canvasSize, const Point& canvasPos, int32 canvasScale)
{
	const Vec2 cursorPos = Cursor::PosF();
	const int32 x = static_cast<int32>(Math::Floor((cursorPos.x - canvasPos.x) / canvasScale));
	const int32 y = static_cast<int32>(Math::Floor((cursorPos.y - canvasPos.y) / canvasScale));

	if (InRange(x, 0, (canvasSize.x - 1))
		&& InRange(y, 0, (canvasSize.y - 1)))
	{
		return Point{ x, y };
	}

	return none;
}

[[nodiscard]]
Rect PixelIndexToRect(const Point& pixelIndex, const Point& canvasPos, int32 canvasScale)
{
	return Rect{ (canvasPos.x + pixelIndex.x * canvasScale), (canvasPos.y + pixelIndex.y * canvasScale), canvasScale, canvasScale };
}

[[nodiscard]]
Color GetPixel(Image& image, const Point& pixelIndex)
{
	assert(InRange(pixelIndex.x, 0, (image.width() - 1)));
	assert(InRange(pixelIndex.y, 0, (image.height() - 1)));
	return image[pixelIndex];
}

bool SetPixel(Image& image, const Point& pixelIndex, const Color& color)
{
	assert(InRange(pixelIndex.x, 0, (image.width() - 1)));
	assert(InRange(pixelIndex.y, 0, (image.height() - 1)));

	const Color oldColor = image[pixelIndex];
	image[pixelIndex] = color;

	return (color != oldColor);
}

bool FillPixel(Image& image, const Point& pixelIndex, DisjointSet<int32>& ds, const Color& color)
{
	assert(InRange(pixelIndex.x, 0, (image.width() - 1)));
	assert(InRange(pixelIndex.y, 0, (image.height() - 1)));

	const int32 index = (pixelIndex.y * image.width() + pixelIndex.x);
	const int32 group = ds.find(index);
	bool updated = false;

	for (int32 y = 0; y < image.height(); ++y)
	{
		for (int32 x = 0; x < image.width(); ++x)
		{
			const int32 i = (y * image.width() + x);

			if (ds.find(i) == group)
			{
				updated |= SetPixel(image, Point{ x, y }, color);
			}
		}
	}

	return updated;
}

// 画像を描画する関数
void DrawImage(const Texture& texture, const Point& canvasPos, int32 canvasScale)
{
	const ScopedRenderStates2D sampler{ SamplerState::ClampNearest };

	texture.scaled(canvasScale).draw(canvasPos);

	for (int32 y = 0; y <= texture.height(); ++y)
	{
		Rect{ (canvasPos.x - 1), (canvasPos.y + y * canvasScale - 1), (texture.width() * canvasScale + 2), 2 }.draw();
	}

	for (int32 x = 0; x <= texture.width(); ++x)
	{
		Rect{ (canvasPos.x + x * canvasScale - 1), (canvasPos.y - 1), 2, (texture.height() * canvasScale + 2) }.draw();
	}
}

// グループ番号を可視化する関数
void DrawGroup(const Font& font, DisjointSet<int32>& ds, const Size& canvasSize, const Point& canvasPos, int32 canvasScale)
{
	assert(ds.size() == (canvasSize.x * canvasSize.y));

	for (int32 y = 0; y < canvasSize.y; ++y)
	{
		for (int32 x = 0; x < canvasSize.x; ++x)
		{
			const int32 i = (y * canvasSize.x + x);
			const int32 group = ds.find(i);
			const Rect rect = PixelIndexToRect(Point{ x, y }, canvasPos, canvasScale);
			font(group).drawAt(12, rect.center());
		}
	}
}

void Main()
{
	Window::Resize(1280, 720);

	Scene::SetBackground(ColorF{ 0.8, 0.9, 1.0 });

	const Font font{ FontMethod::MSDF, 36, Typeface::Bold };

	// 画像のサイズ
	constexpr Size CanvasSize{ 16, 16 };

	// 総ピクセル数
	constexpr int32 NumPixels = (CanvasSize.x * CanvasSize.y);

	// デフォルトの色
	constexpr Color DefaultColor{ 255, 255, 255, 0 };

	// 画像の拡大率
	constexpr int32 CanvasScale = 32;

	// 画像の描画位置
	constexpr Point CanvasPos{ 200, 60 };

	// ペンの色
	Color penColor{ 0, 0, 0, 255 };
	HSV penColorHSV = penColor;

	// 画像
	Image image{ CanvasSize, DefaultColor };

	// 塗りつぶしグループ情報(上下左右で接続されている同じ色 → 同じグループ番号)
	DisjointSet<int32> ds(NumPixels);

	// グループ情報を更新する
	RebuildGroup(ds, image);

	// 動的テクスチャ
	DynamicTexture dtexture{ image };

	while (System::Update())
	{
		// 選択されているピクセルのインデックス
		const Optional<Point> pixelIndex = GetPixelIndexFromCursorPos(CanvasSize, CanvasPos, CanvasScale);

		ClearPrint();
		Print << pixelIndex;

		// 更新
		if (pixelIndex)
		{
			// 左クリックでピクセルの更新
			if (MouseL.pressed())
			{
				if (SetPixel(image, *pixelIndex, penColor))
				{
					dtexture.fill(image);
					RebuildGroup(ds, image);
				}
			}

			// 右クリックで塗りつぶし
			if (MouseR.pressed())
			{
				if (FillPixel(image, *pixelIndex, ds, penColor))
				{
					dtexture.fill(image);
					RebuildGroup(ds, image);
				}
			}
		}

		// 描画
		{
			// 画像の描画
			DrawImage(dtexture, CanvasPos, CanvasScale);

			// グループ番号の可視化
			DrawGroup(font, ds, CanvasSize, CanvasPos, CanvasScale);

			// マウスオーバー時のピクセルの枠線
			if (pixelIndex)
			{
				Cursor::RequestStyle(CursorStyle::Hand);

				PixelIndexToRect(*pixelIndex, CanvasPos, CanvasScale).drawFrame(4, 0, penColor);
			}

			// カラーピッカー
			if (SimpleGUI::ColorPicker(penColorHSV, Vec2{ 900, 40 }))
			{
				penColor = penColorHSV;
			}
		}
	}
}
10. 幅優先探索の可視化
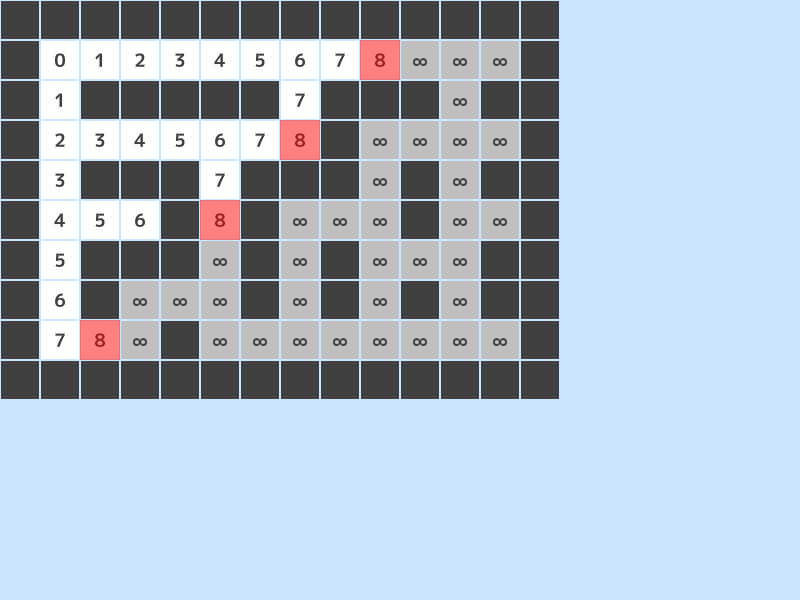
コード
# include <Siv3D.hpp>

void Main()
{
	// 背景色を水色に
	Scene::SetBackground(ColorF{ 0.8, 0.9, 1.0 });

	// 距離の表示用フォント
	const Font font{ FontMethod::MSDF, 48, Typeface::Bold };

	// 迷路を可視化するときのマスのサイズ(ピクセル)
	constexpr int32 CellSize = 40;

	// 二次元配列: 迷路 (0: 通行可能, 1: 壁)
	const Grid<int32> maze =
	{
		{ 1, 1, 1, 1, 1, 1, 1, 1, 1, 1, 1, 1, 1, 1 },
		{ 1, 0, 0, 0, 0, 0, 0, 0, 0, 0, 0, 0, 0, 1 },
		{ 1, 0, 1, 1, 1, 1, 1, 0, 1, 1, 1, 0, 1, 1 },
		{ 1, 0, 0, 0, 0, 0, 0, 0, 1, 0, 0, 0, 0, 1 },
		{ 1, 0, 1, 1, 1, 0, 1, 1, 1, 0, 1, 0, 1, 1 },
		{ 1, 0, 0, 0, 1, 0, 1, 0, 0, 0, 1, 0, 0, 1 },
		{ 1, 0, 1, 1, 1, 0, 1, 0, 1, 0, 0, 0, 1, 1 },
		{ 1, 0, 1, 0, 0, 0, 1, 0, 1, 0, 1, 0, 1, 1 },
		{ 1, 0, 0, 0, 1, 0, 0, 0, 0, 0, 0, 0, 0, 1 },
		{ 1, 1, 1, 1, 1, 1, 1, 1, 1, 1, 1, 1, 1, 1 },
	};

	// 無限大を表現する数
	constexpr int32 INF = 10000;

	// 二次元配列: maze と同じサイズ、すべての要素を INF にセット
	Grid<int32> distances(maze.size(), INF);

	// 上、左、右、下のマスへのオフセット
	constexpr Point Offsets[4] = { Point{ 0, -1 }, Point{ -1, 0 }, Point{ 1, 0 }, Point{ 0, 1 } };

	// 全要素を確認できるように、std::queue の代わりに std::deque を使う
	std::deque<Point> q;

	// スタート位置
	const Point start{ 1, 1 };
	q.push_back(start);
	distances[start] = 0;

	// 更新の間隔(秒)
	constexpr double UpdateTime = 0.5;

	// 蓄積時間(秒)
	double accumulatedTime = 0.0;

	while (System::Update())
	{
		// 状態更新フラグ
		bool update = false;

		// 前フレームからの経過時間を加算
		accumulatedTime += Scene::DeltaTime();

		// 更新間隔を超えていたら
		if (UpdateTime <= accumulatedTime)
		{
			accumulatedTime -= UpdateTime;

			update = true;
		}

		// 幅優先探索
		if (update && (not q.empty()))
		{
			const Point currentPos = q.front(); q.pop_front();
			const int32 currentDistance = distances[currentPos];

			for (const auto& offset : Offsets)
			{
				const Point nextPos = (currentPos + offset);

				if ((maze[nextPos] == 0) && ((currentDistance + 1) < distances[nextPos]))
				{
					distances[nextPos] = (currentDistance + 1);
					q.push_back(nextPos);
				}
			}
		}

		// 迷路の状態を可視化
		for (int32 y = 0; y < maze.height(); ++y)
		{
			for (int32 x = 0; x < maze.width(); ++x)
			{
				// マスの正方形
				const Rect rect = Rect{ (x * CellSize), (y * CellSize), CellSize }.stretched(-1);

				if (maze[y][x] == 1) // 壁のマス
				{
					// 黒で表示
					rect.draw(ColorF{ 0.25 });
				}
				else // 通行可能なマス
				{
					// 距離情報
					const int32 distance = distances[y][x];

					if (distance == INF)
					{
						// 灰色で表示
						rect.draw(ColorF{ 0.75 });

						font(U"∞").drawAt(18, rect.center(), ColorF{ 0.25 });
					}
					else
					{
						// 白で表示
						rect.draw();

						font(distances[y][x]).drawAt(18, rect.center(), ColorF{ 0.25 });
					}
				}
			}
		}

		// queue に入っているマスの可視化
		for (const auto& point : q)
		{
			// 赤い半透明の正方形を重ねる
			Rect{ (point * CellSize), CellSize }.draw(ColorF{ 1.0, 0.0, 0.0, 0.5 });
		}
	}
}
11. 二次元いもす法の可視化
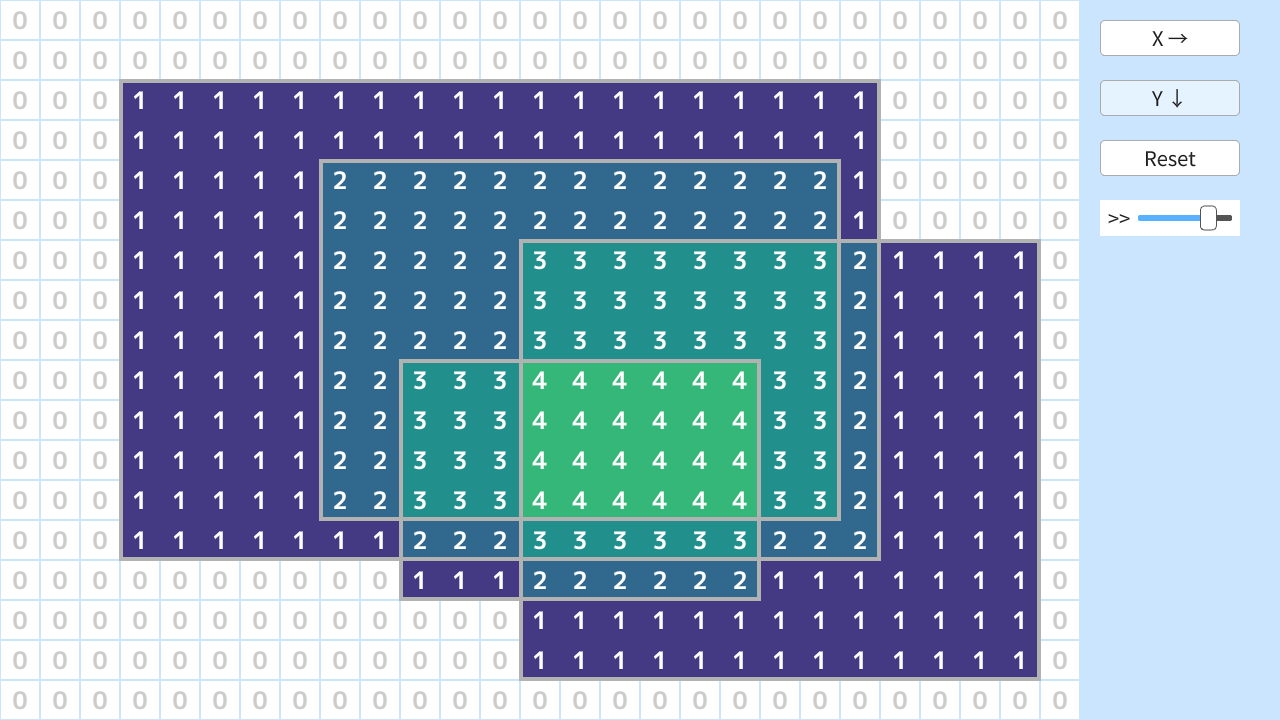
コード
# include <Siv3D.hpp>

void Main()
{
	Window::Resize(1280, 720);
	Scene::SetBackground(ColorF{ 0.8, 0.9, 1.0 });

	// フォント
	const Font font{ FontMethod::MSDF, 48, Typeface::Bold };

	// セルの大きさ
	constexpr int32 CellSize = 40;

	// マス目の数
	constexpr Size GridSize{ 1080 / CellSize, 720 / CellSize };

	Grid<int32> grid(GridSize);

	// 選択開始したセル
	Optional<Point> grabbed;

	// 長方形領域
	Array<Rect> rects;

	// 累積和計算位置
	int32 iX = GridSize.x;
	int32 iY = GridSize.y;

	// 累積和アニメーションのストップウォッチ
	Stopwatch stopwatch;

	// アニメーションの速さ
	double speed = 0.4;

	while (System::Update())
	{
		// すべてのマスを描画
		for (auto p : step(GridSize))
		{
			const Rect rect{ (p * CellSize), CellSize };

			if (auto value = grid[p])
			{
				const ColorF color = (value < 0)
					? ColorF{ 0.0, 0.4, 0.8 } : Colormap01F((value / 6.0), ColormapType::Viridis);

				rect.stretched(1).draw(color);
			}
			else
			{
				rect.stretched(-1).draw();
			}
		}

		// セルの数値を描画
		for (auto p : step(GridSize))
		{
			const Rect rect = Rect{ (p * CellSize), CellSize }.stretched(-1);

			font(grid[p]).drawAt(24, rect.center(), ColorF{ grid[p] ? 1.0 : 0.8 });
		}

		// 長方形の領域を描画
		for (const auto& rect : rects)
		{
			Rect{ (rect.pos * CellSize), (rect.size * CellSize) }
				.drawFrame(3, 1, ColorF{ 0.7 });
		}

		// 領域の選択を開始
		if (MouseL.down())
		{
			const Point pos = (Cursor::Pos() / CellSize);

			if (InRange(pos.x, 0, (GridSize.x - 1))
				&& InRange(pos.y, 0, (GridSize.y - 1)))
			{
				grabbed = pos;
			}
		}

		// 領域選択中
		if (grabbed)
		{
			Point pos = (Cursor::Pos() / CellSize);
			pos.x = Clamp(pos.x, 0, (GridSize.x - 1));
			pos.y = Clamp(pos.y, 0, (GridSize.y - 1));

			const Size size = (pos - *grabbed);

			Rect rect{ *grabbed, size };

			if (rect.w < 0)
			{
				rect.x += rect.w;
				rect.w *= -1;
			}

			if (rect.h < 0)
			{
				rect.y += rect.h;
				rect.h *= -1;
			}

			rect.size += Size::One();

			Rect{ rect.pos * CellSize, rect.size * CellSize }
				.draw(ColorF{ 0.1, 0.4, 0.7, 0.4 })
				.drawFrame(3, 1, ColorF{ 0.7 });

			if (MouseL.up())
			{
				rects << rect;

				const Point tl = rect.tl();
				const Point br = rect.br();

				++grid[tl];

				if ((br.x < GridSize.x) && (br.y < GridSize.y))
				{
					++grid[br];
				}

				if (br.x < GridSize.x)
				{
					--grid[{ br.x, tl.y }];
				}

				if (br.y < GridSize.y)
				{
					--grid[{ tl.x, br.y }];
				}

				grabbed.reset();
			}
		}

		if (SimpleGUI::Button(U"X →", Vec2{ 1100, 20 }, 140))
		{
			iX = 1;
			stopwatch.restart();
		}

		if (SimpleGUI::Button(U"Y ↓", Vec2{ 1100, 80 }, 140))
		{
			iY = 1;
			stopwatch.restart();
		}

		if (SimpleGUI::Button(U"Reset", Vec2{ 1100, 140 }, 140))
		{
			rects.clear();
			grid.fill(0);
			iX = GridSize.x;
			iY = GridSize.y;
		}

		SimpleGUI::Slider(U">>", speed, 0.0, 0.5, Vec2{ 1100, 200 }, 30, 110);

		// X 方向累積和(アニメーション)
		if (iX < GridSize.x)
		{
			Line{ (iX * CellSize), 0, (iX * CellSize), 720 }.draw(4, Palette::Red);

			if (SecondsF{ 0.5 - speed } <= stopwatch)
			{
				for (int32 y = 0; y < GridSize.y; ++y)
				{
					grid[y][iX] += grid[y][iX - 1];
				}

				++iX;
				stopwatch.restart();
			}
		}

		// Y 方向累積和(アニメーション)
		if (iY < GridSize.y)
		{
			Line{ 0, (iY * CellSize), 1080, (iY * CellSize) }.draw(4, Palette::Red);

			if (SecondsF{ 0.5 - speed } <= stopwatch)
			{
				for (int32 x = 0; x < GridSize.x; ++x)
				{
					grid[iY][x] += grid[iY - 1][x];
				}

				++iY;
				stopwatch.restart();
			}
		}
	}
}